Traefik Manager – UI Examples
Initial Setup
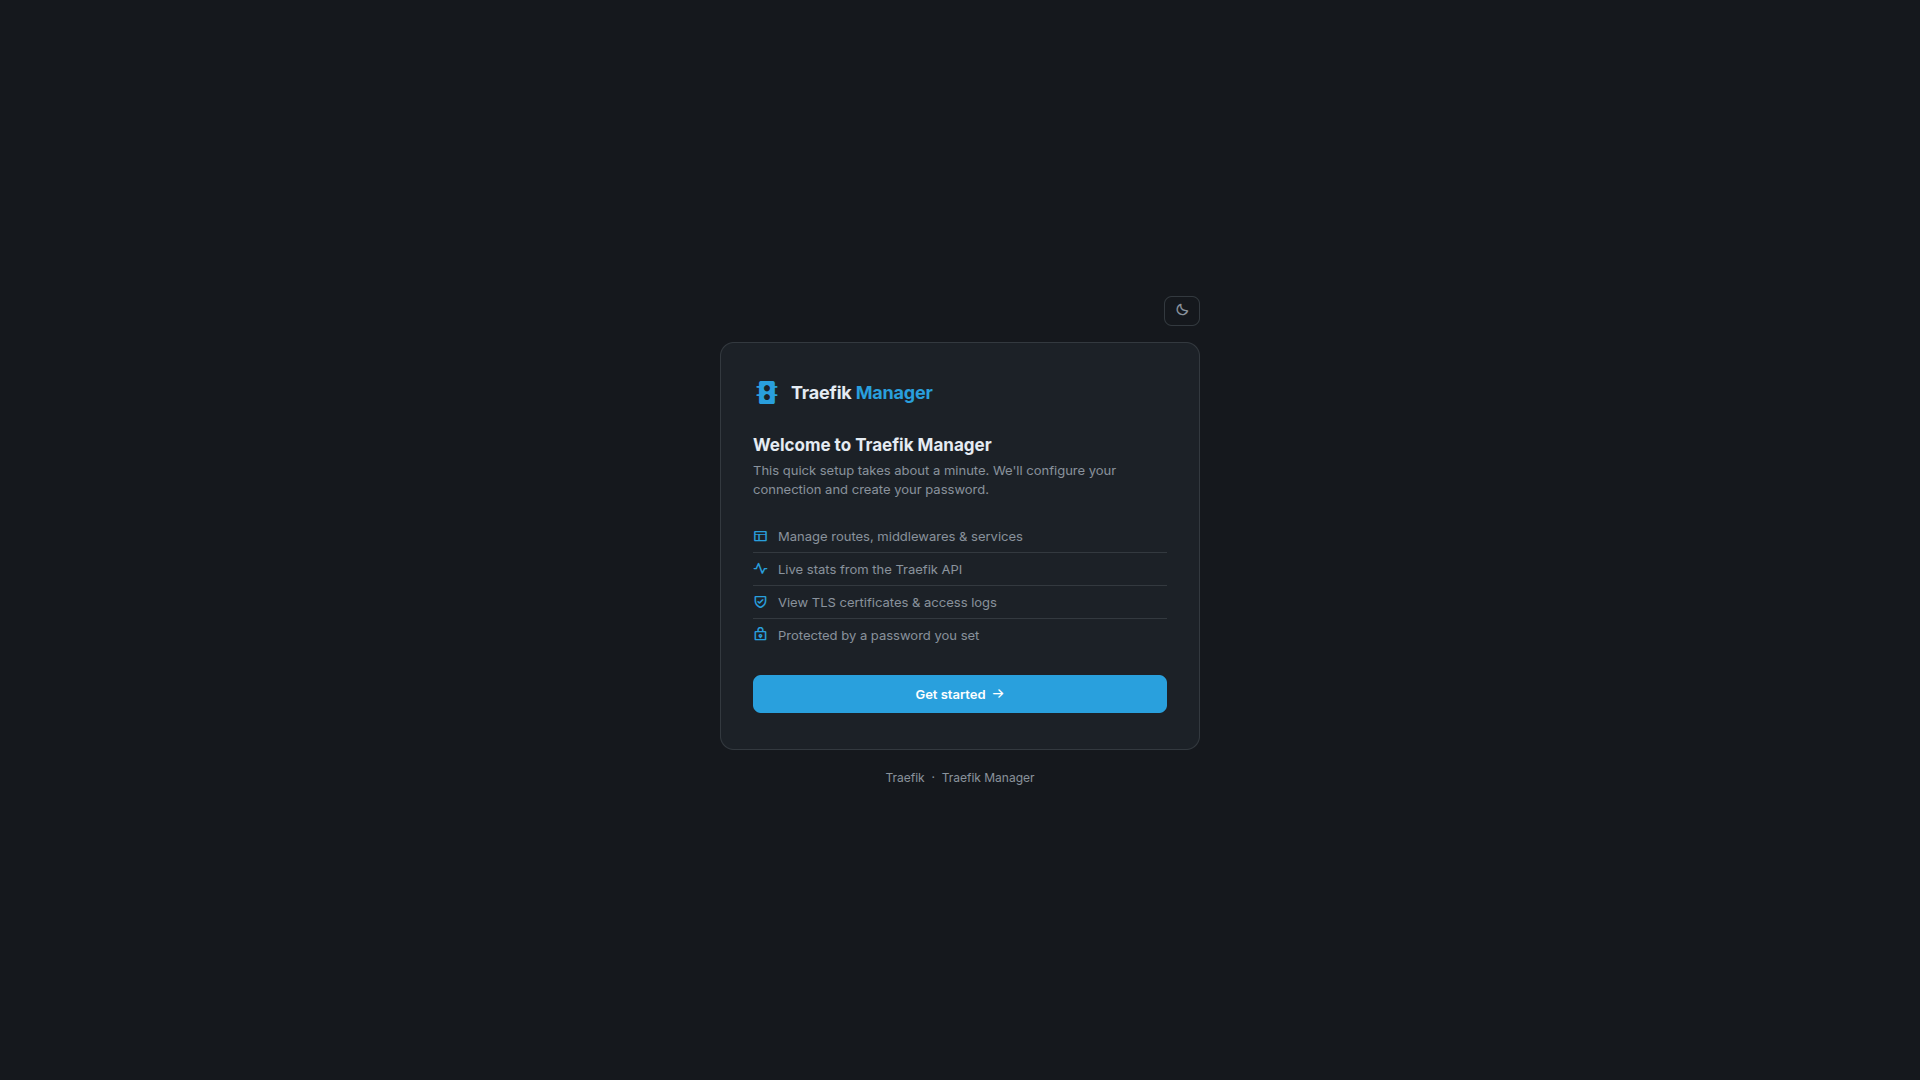
When first launching Traefik Manager you are guided through a short setup wizard.
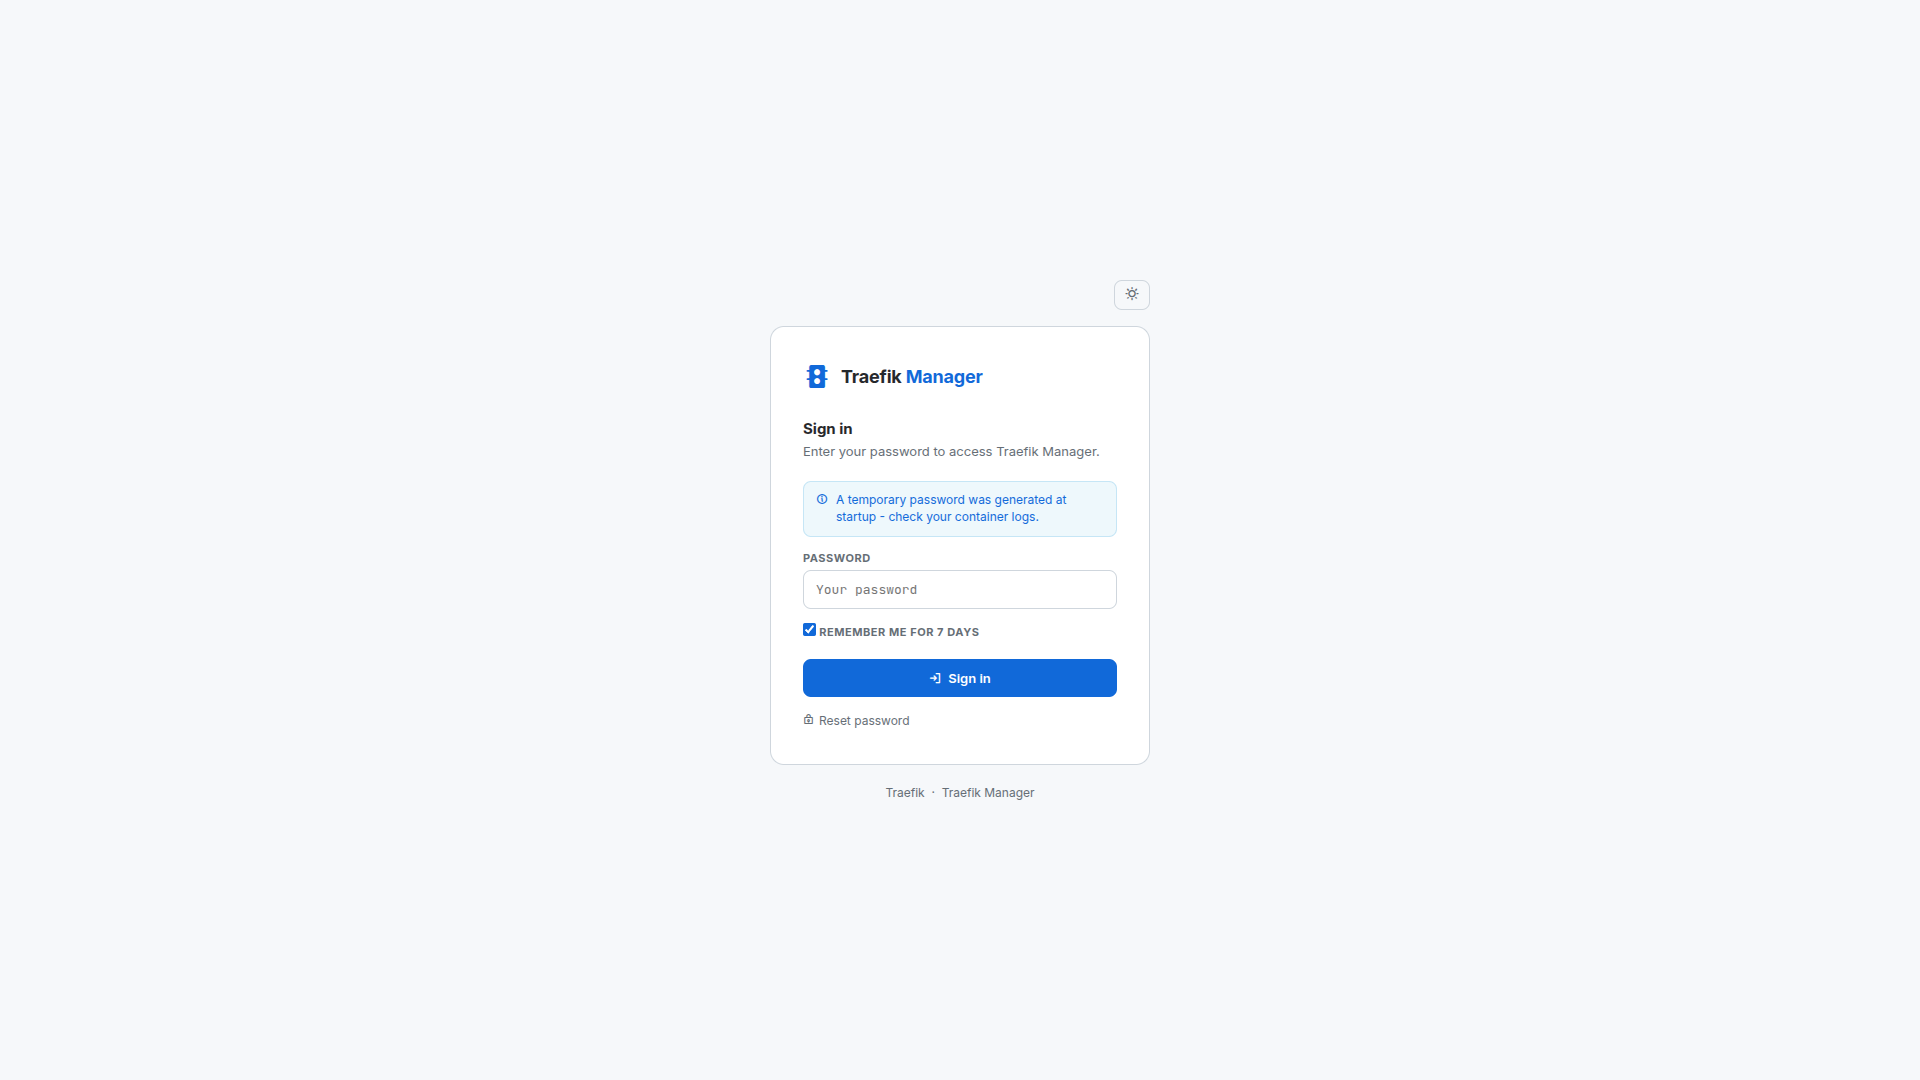
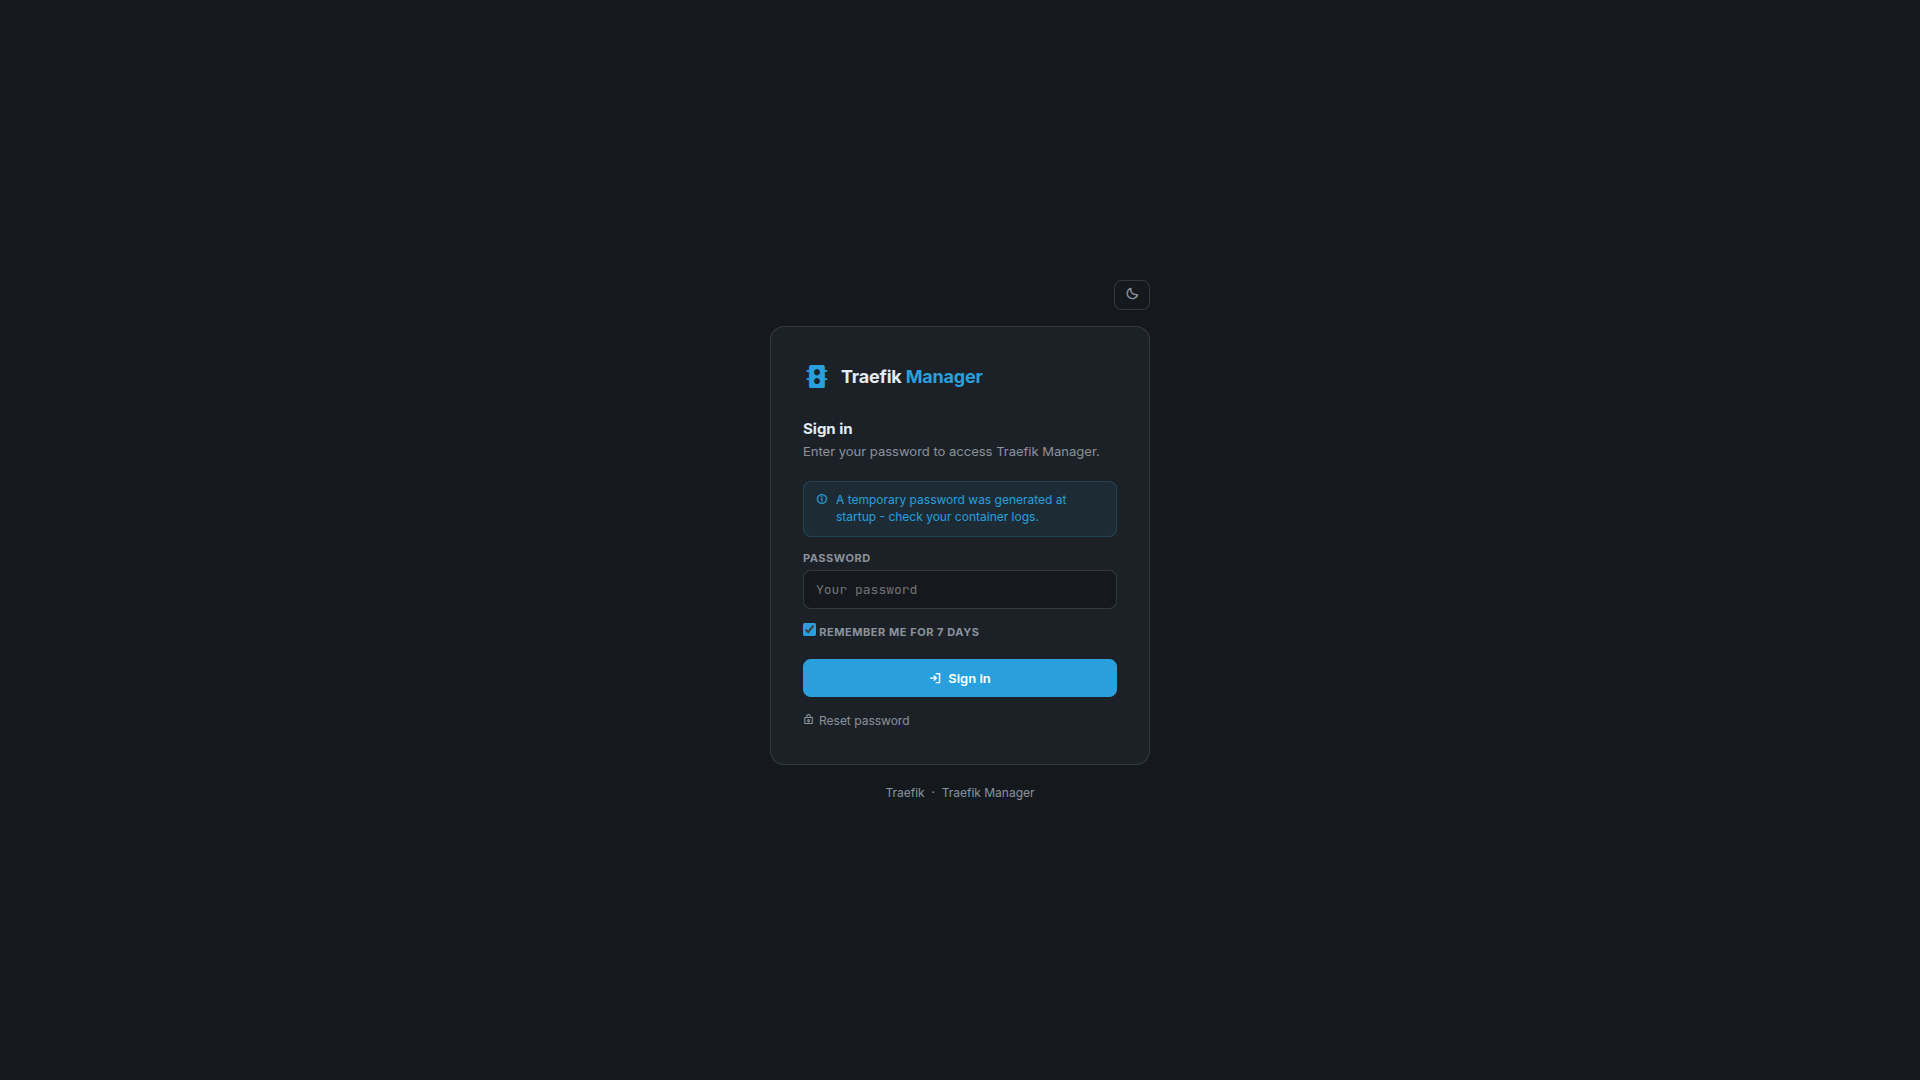
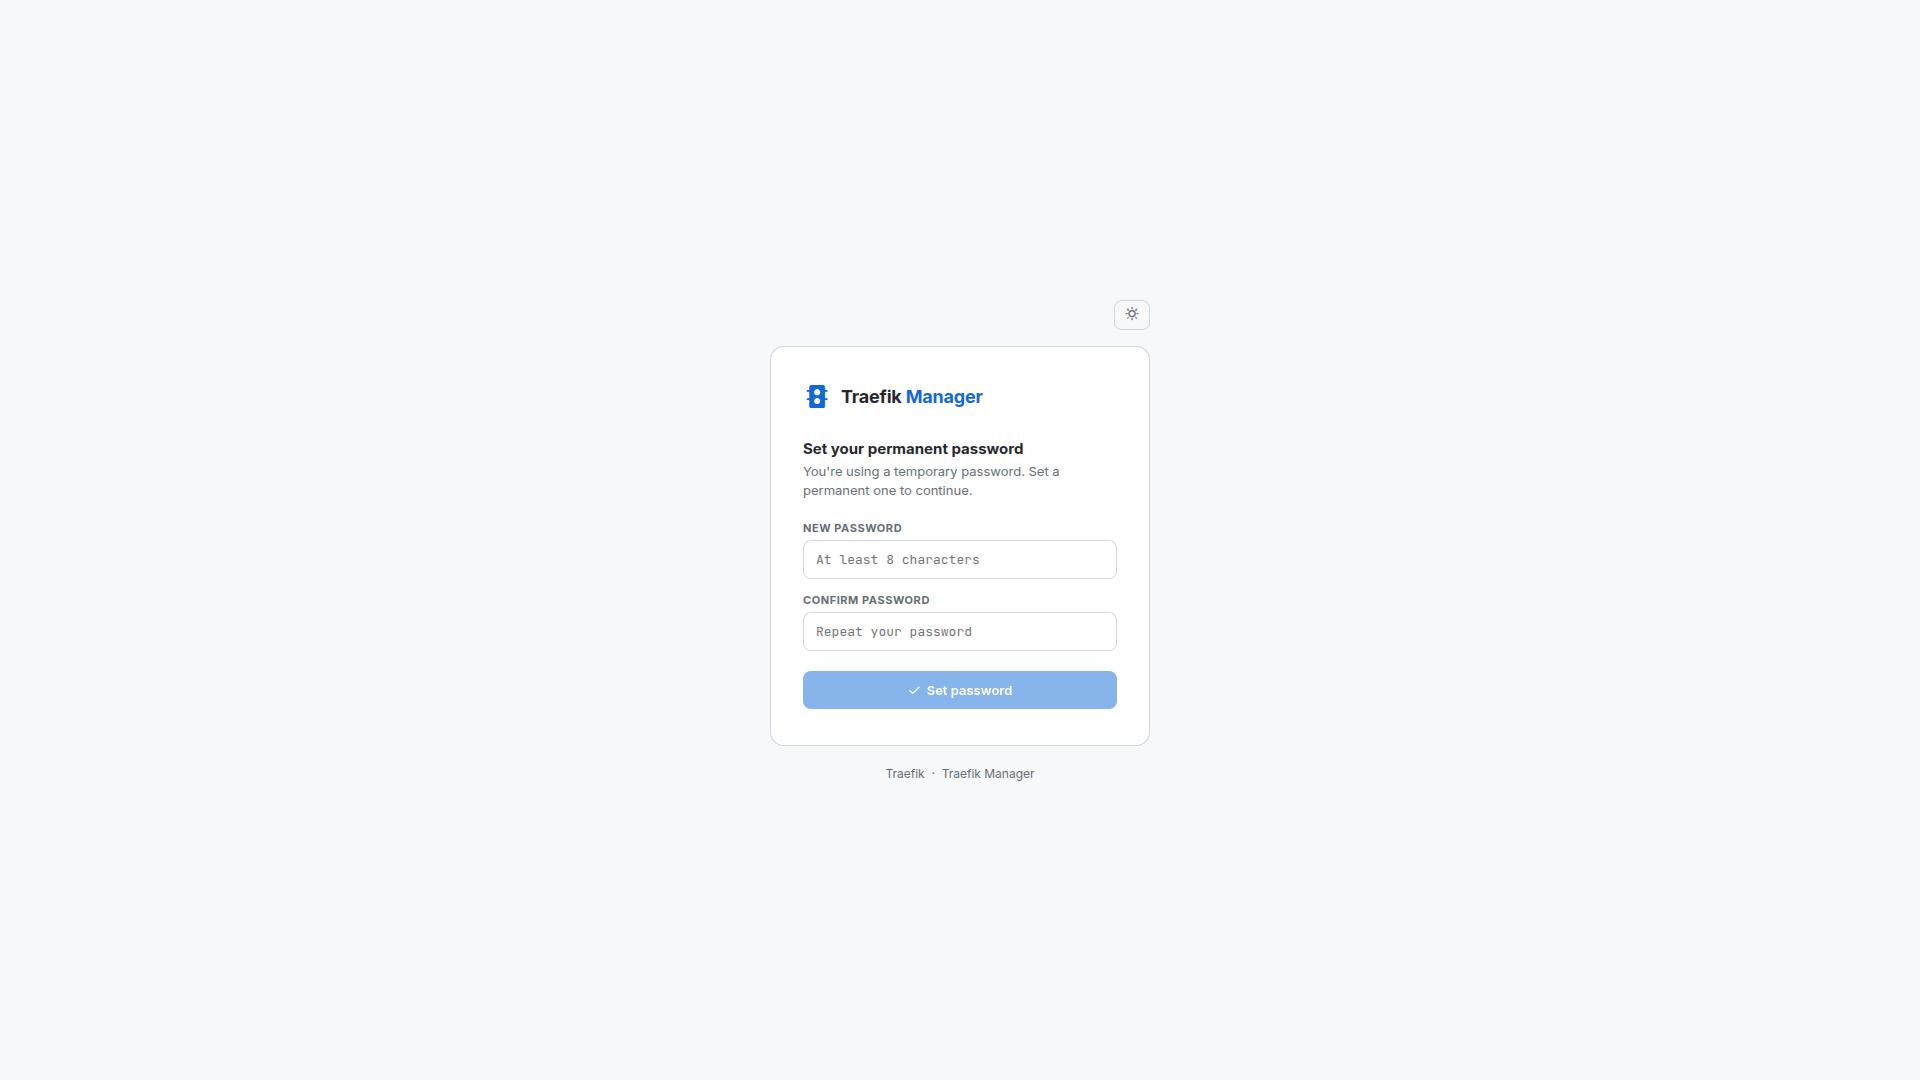
Step 1 - Temporary password
Step 2 - Welcome

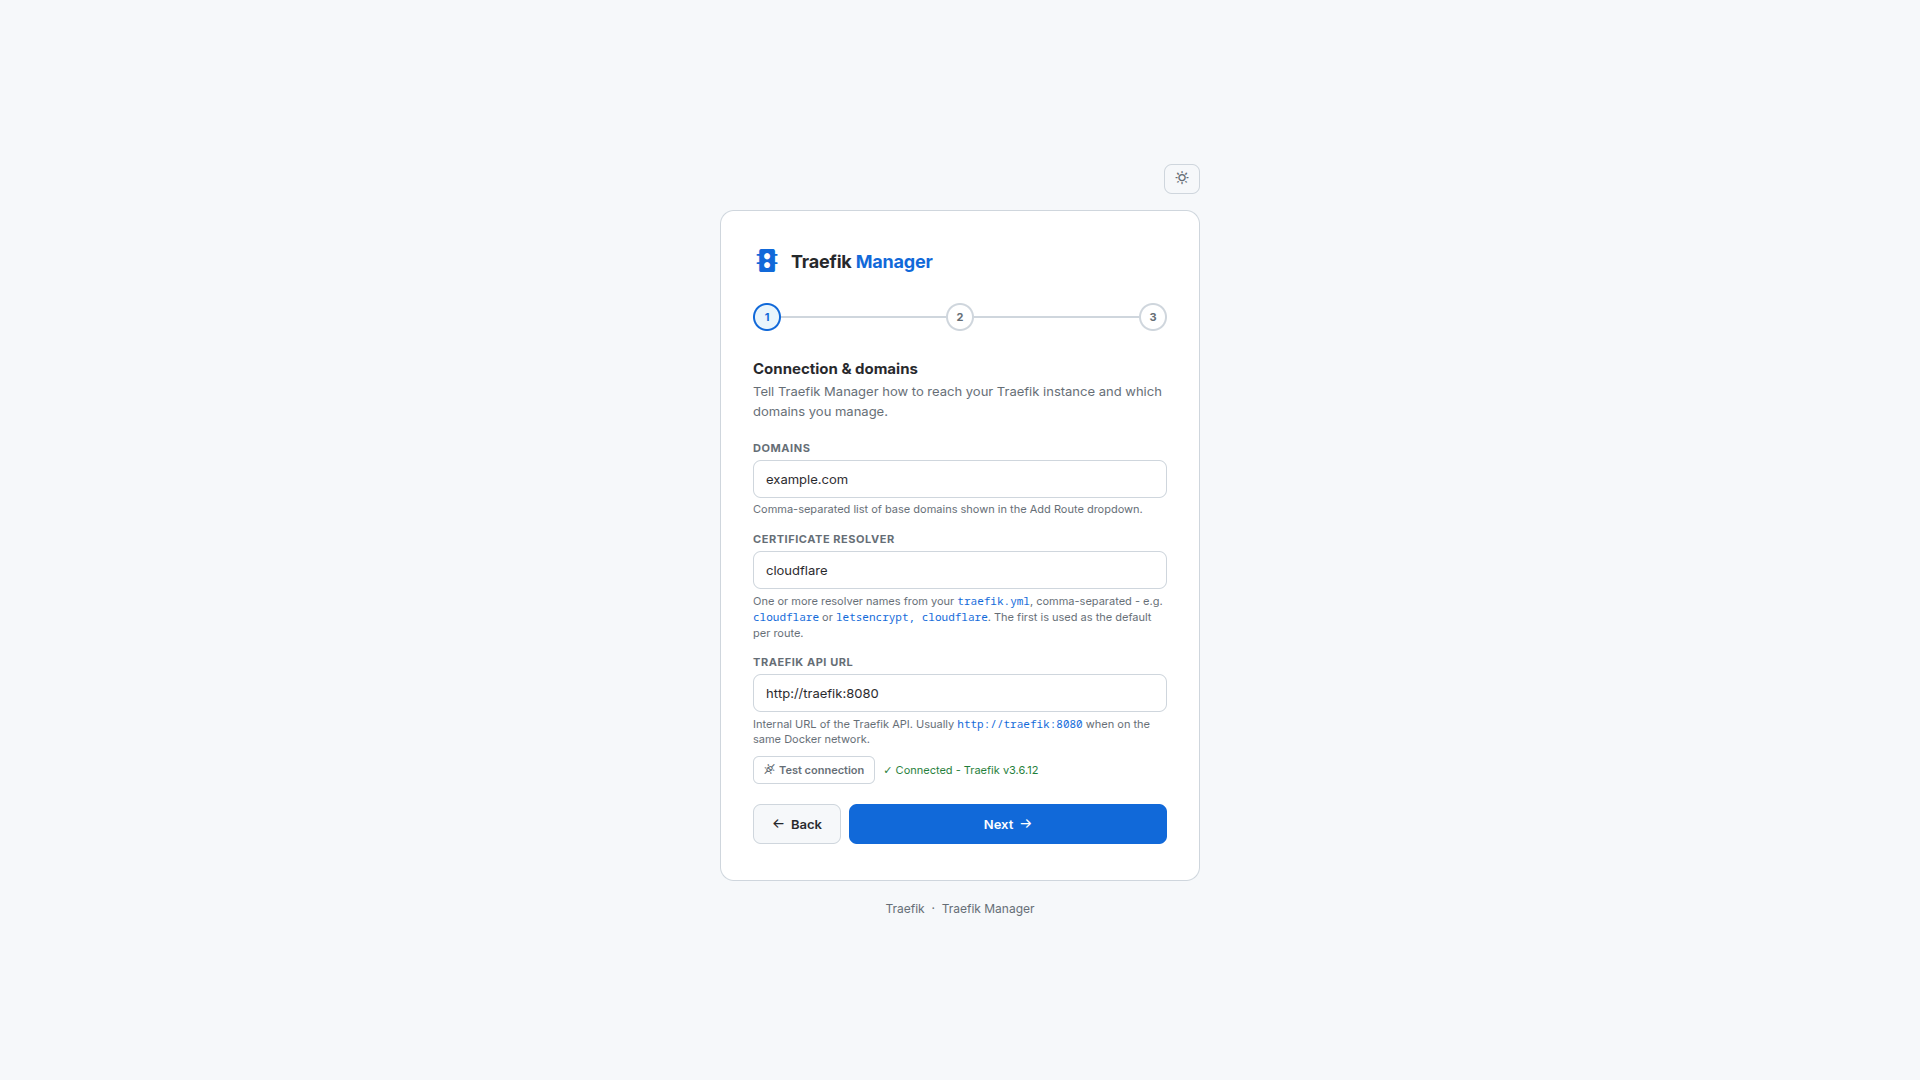
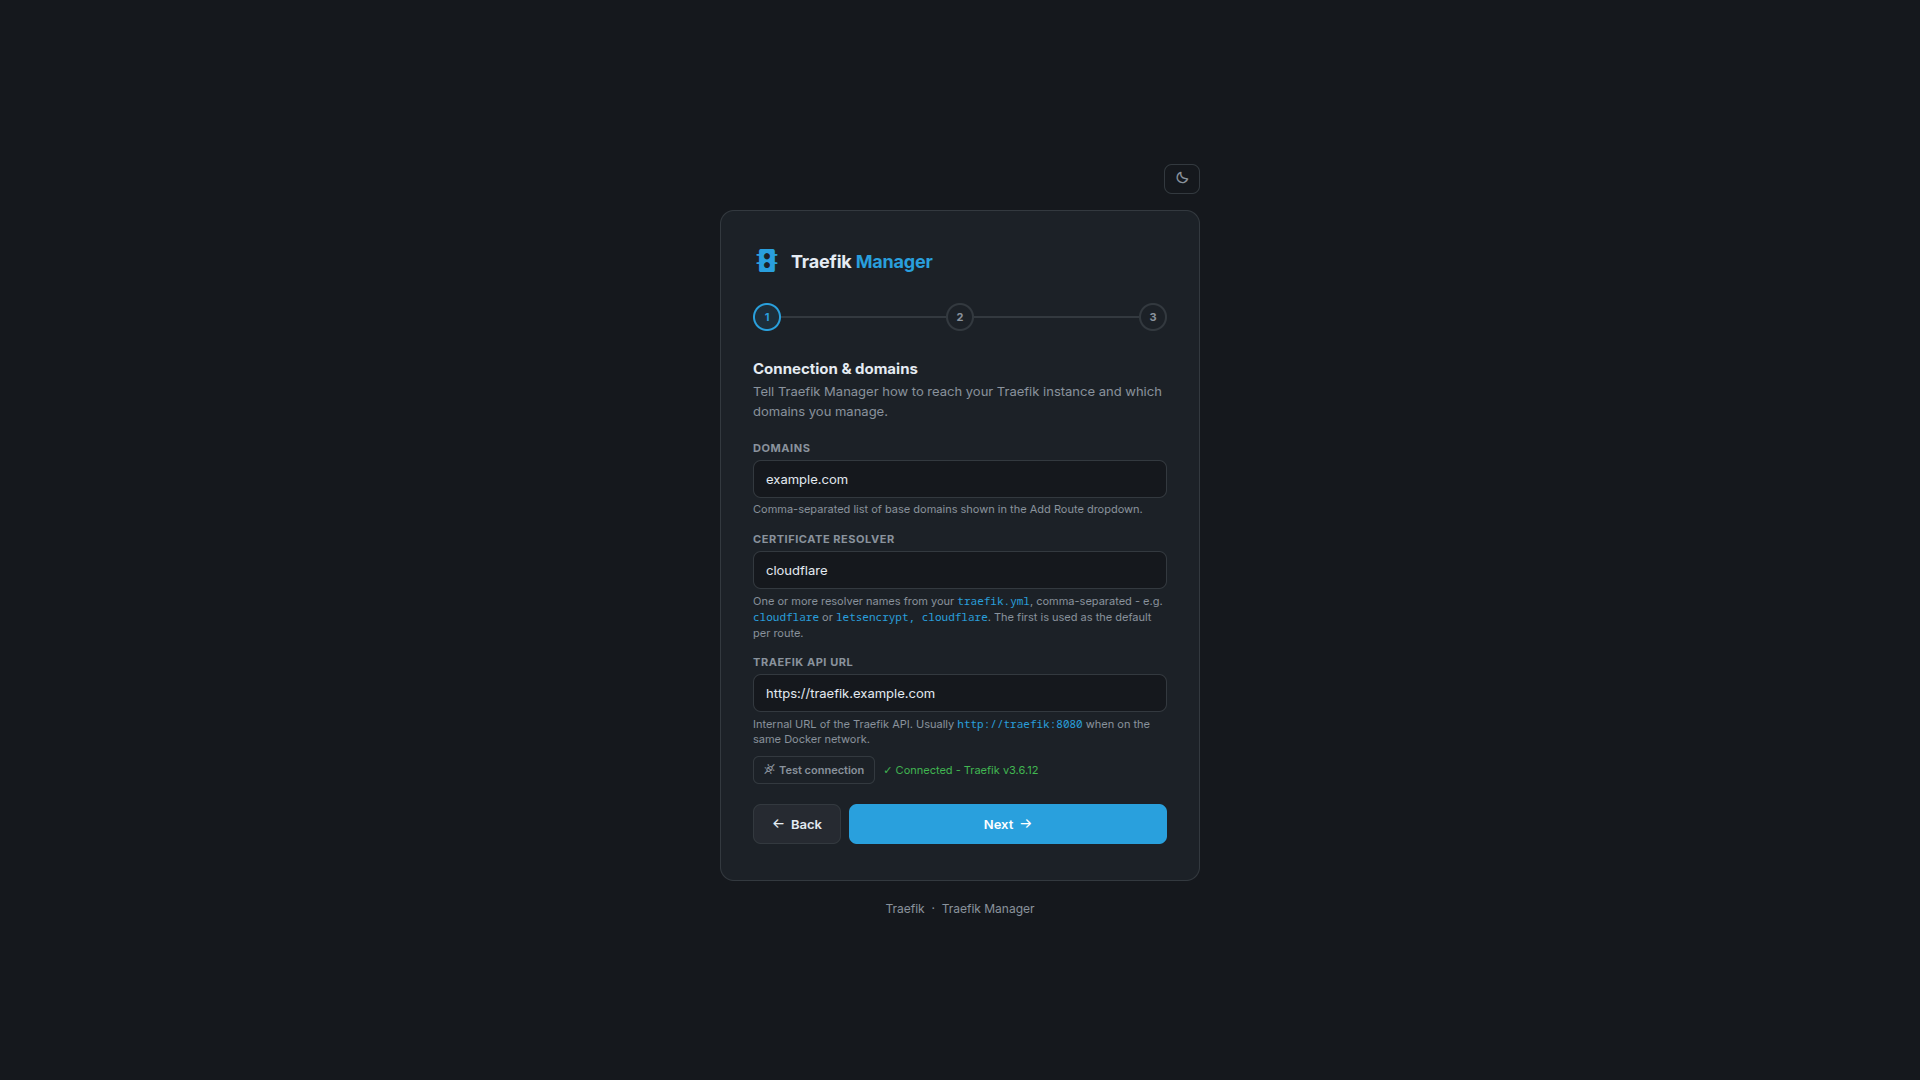
Step 3 - Connection & domains
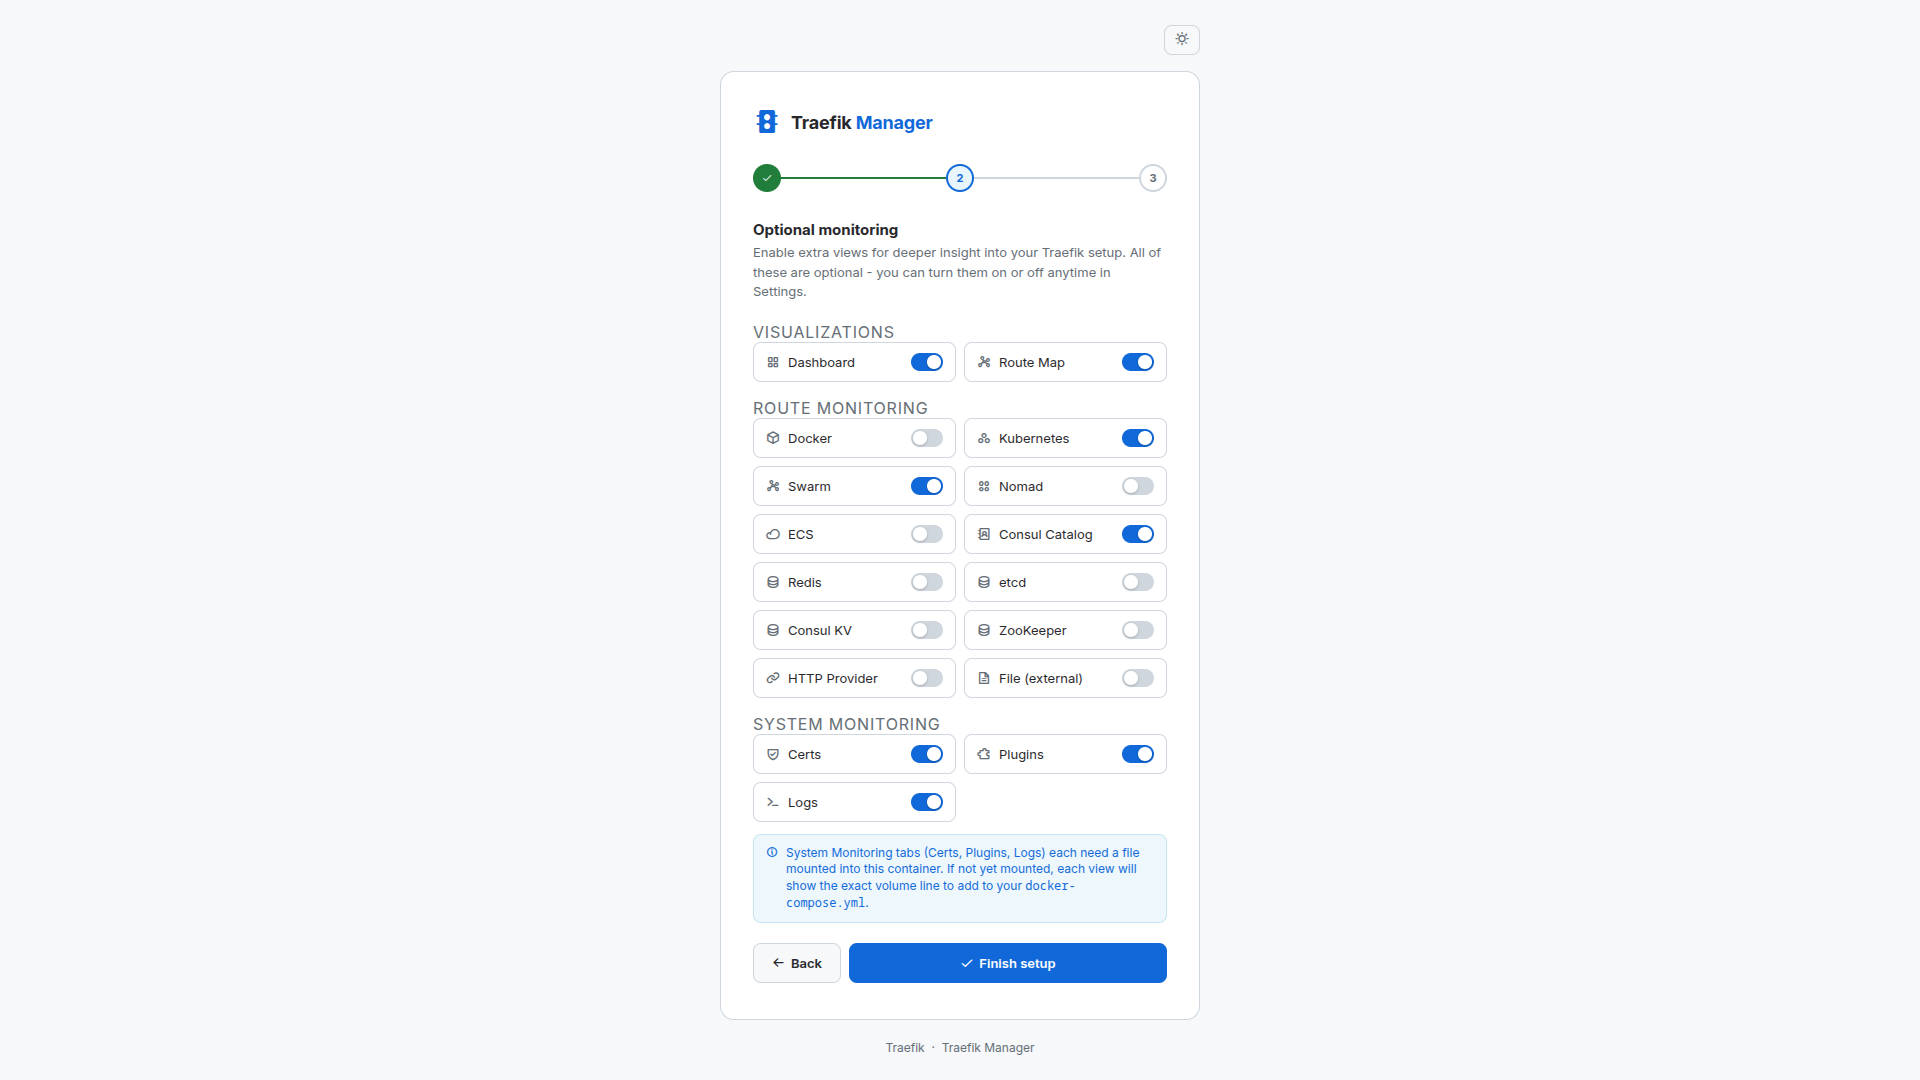
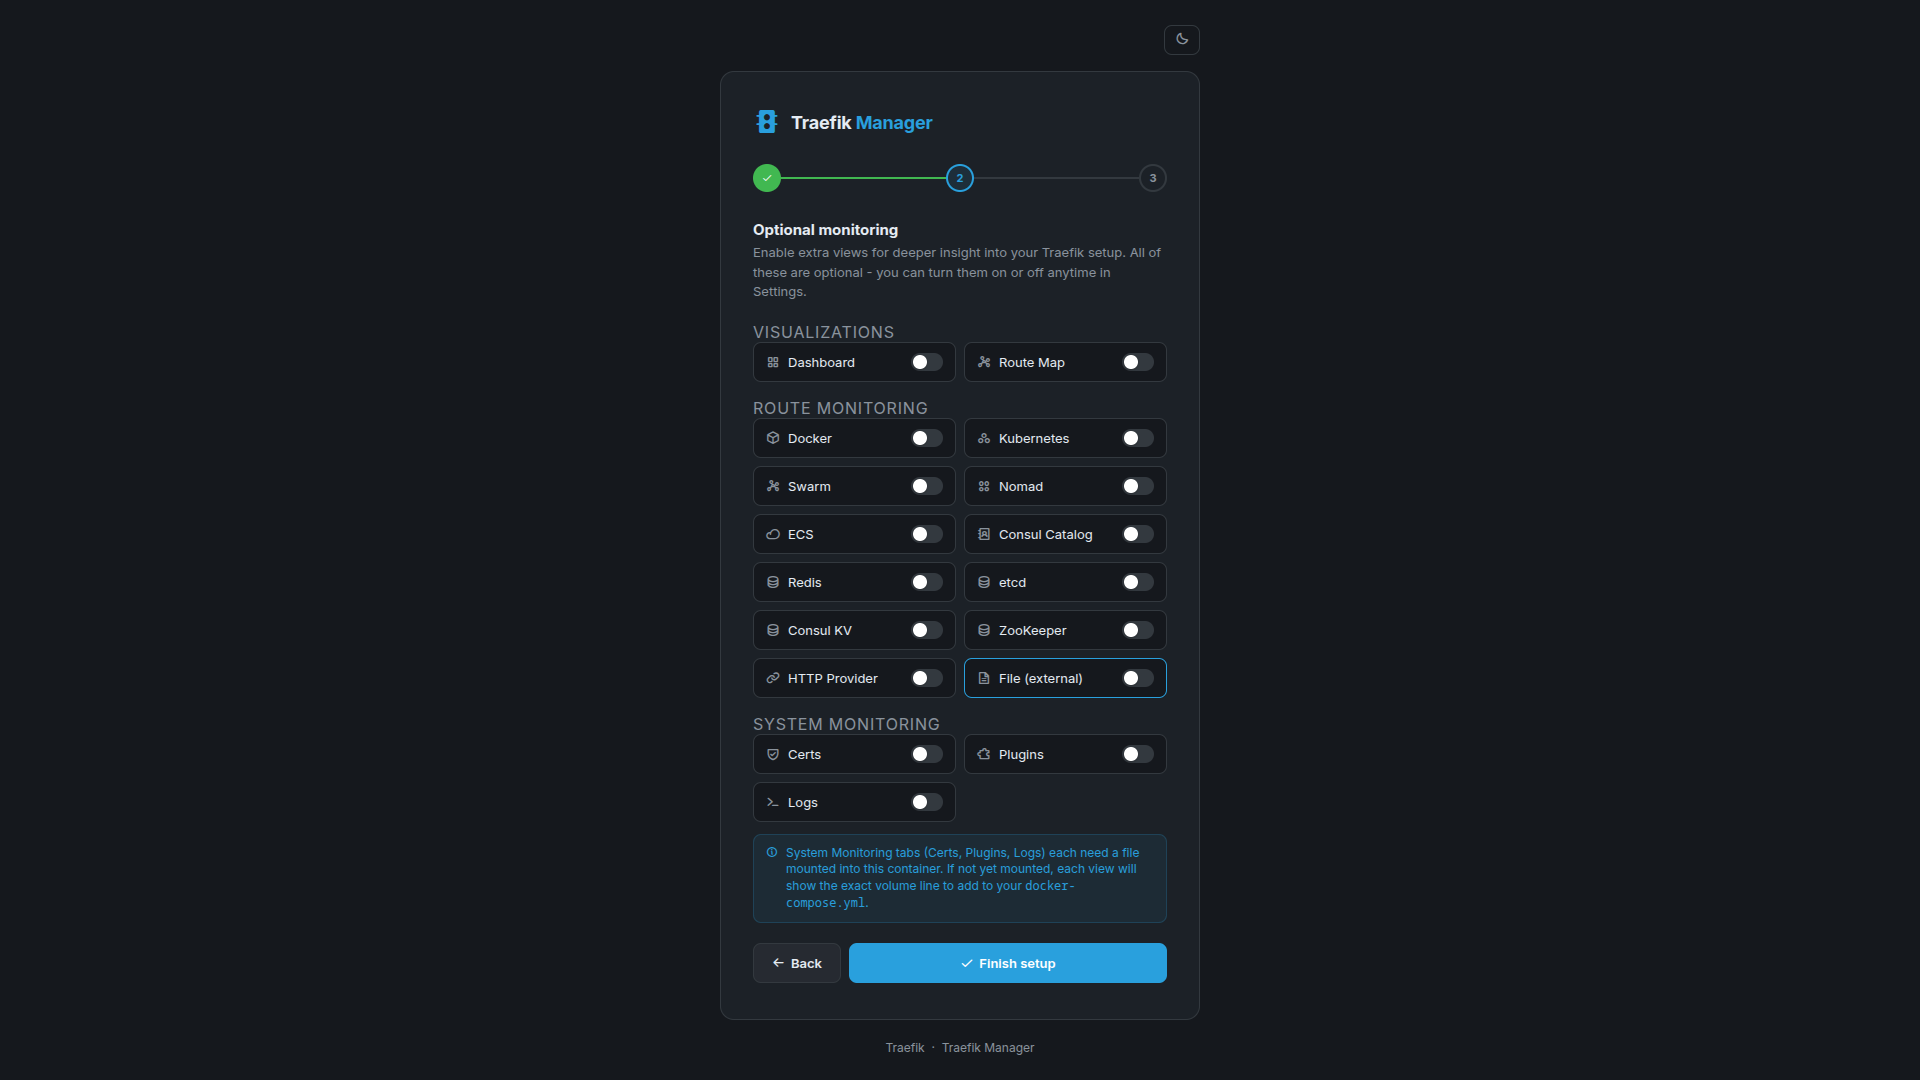
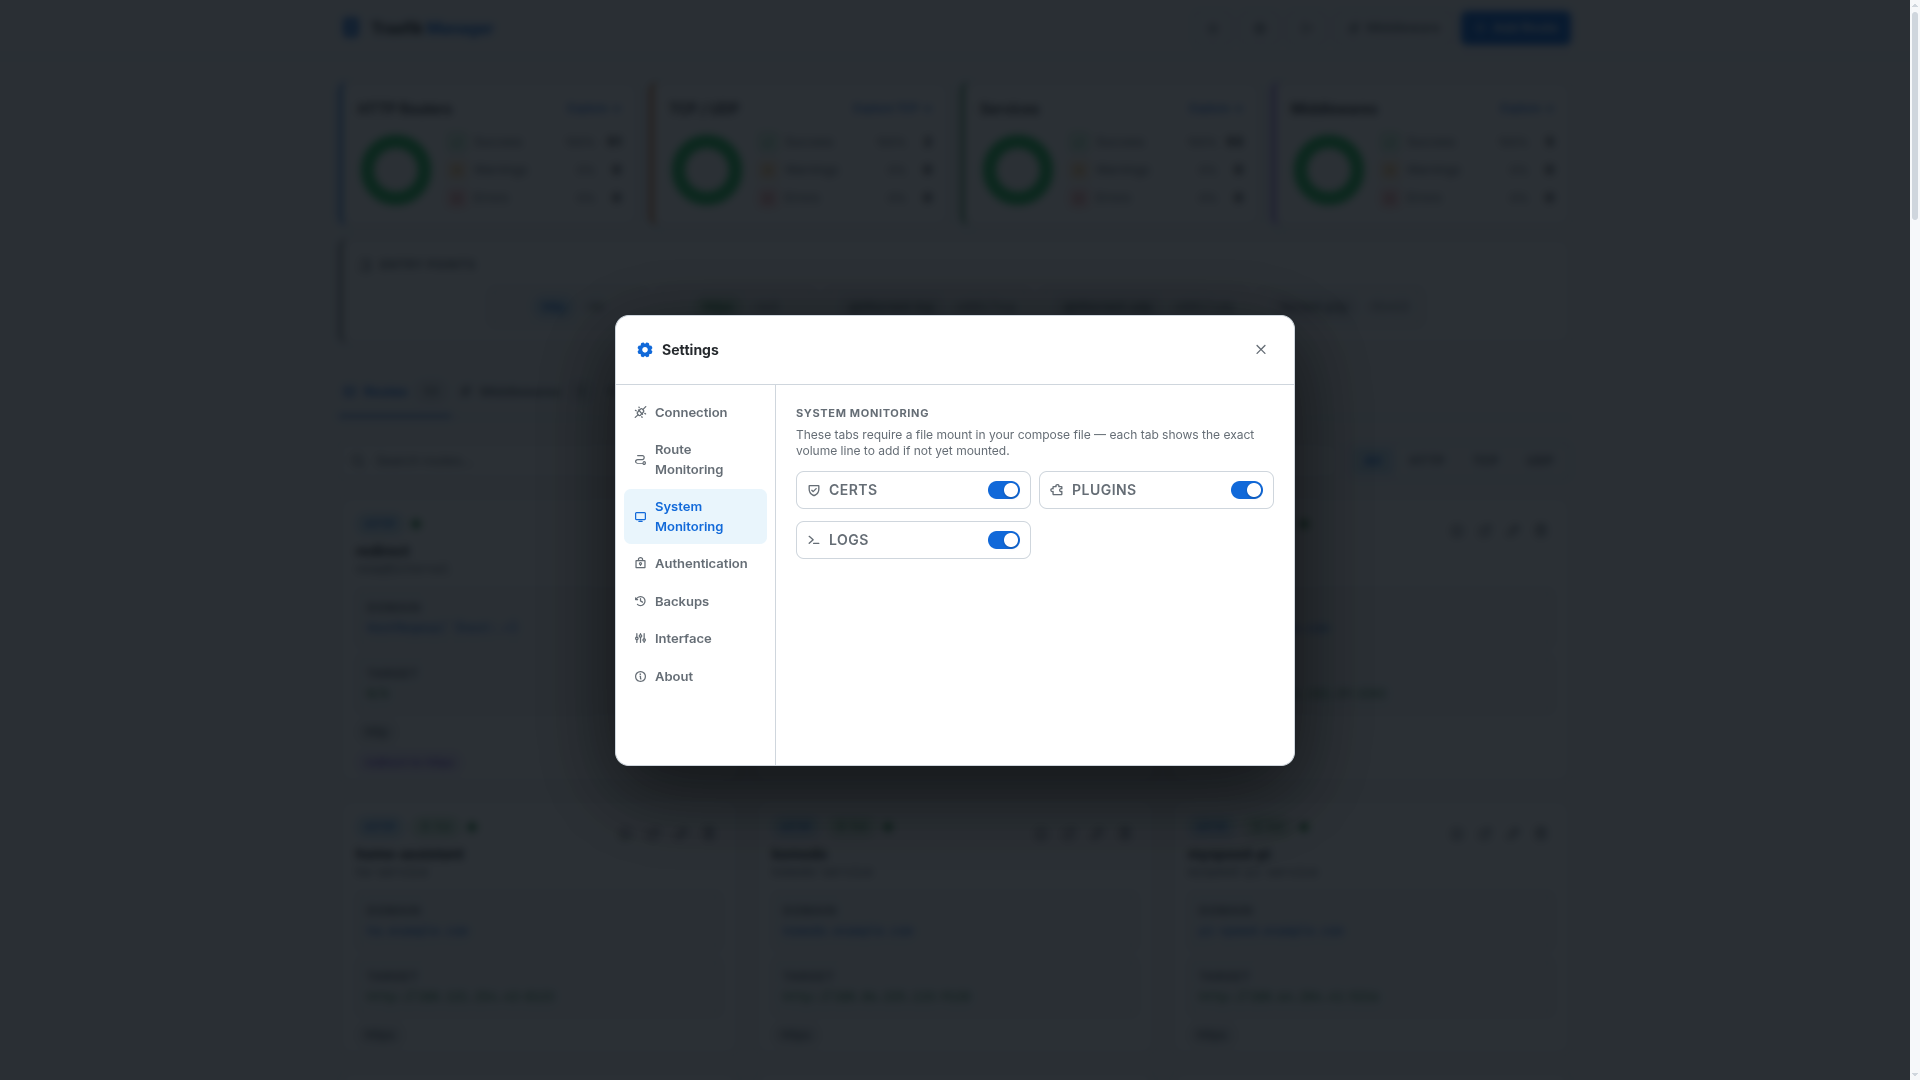
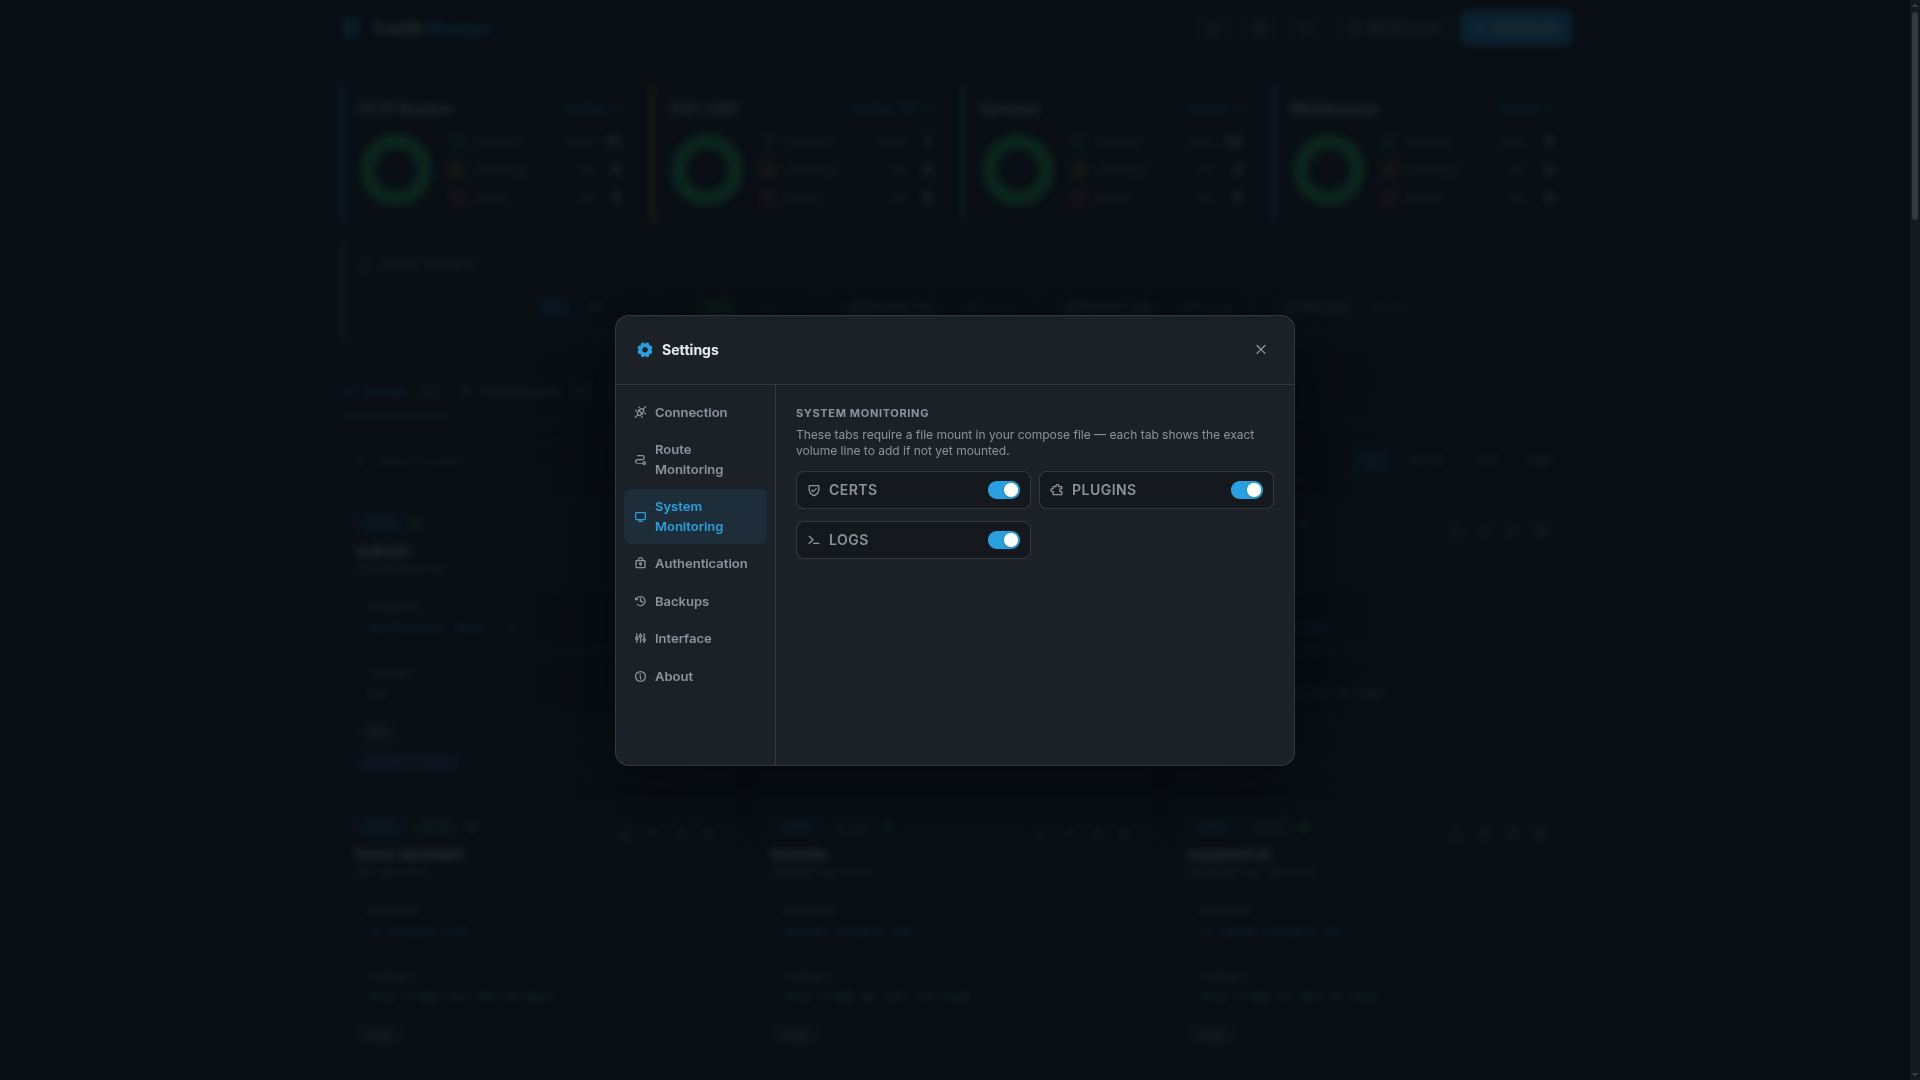
Step 4 - Optional tabs
Step 5 - Set password
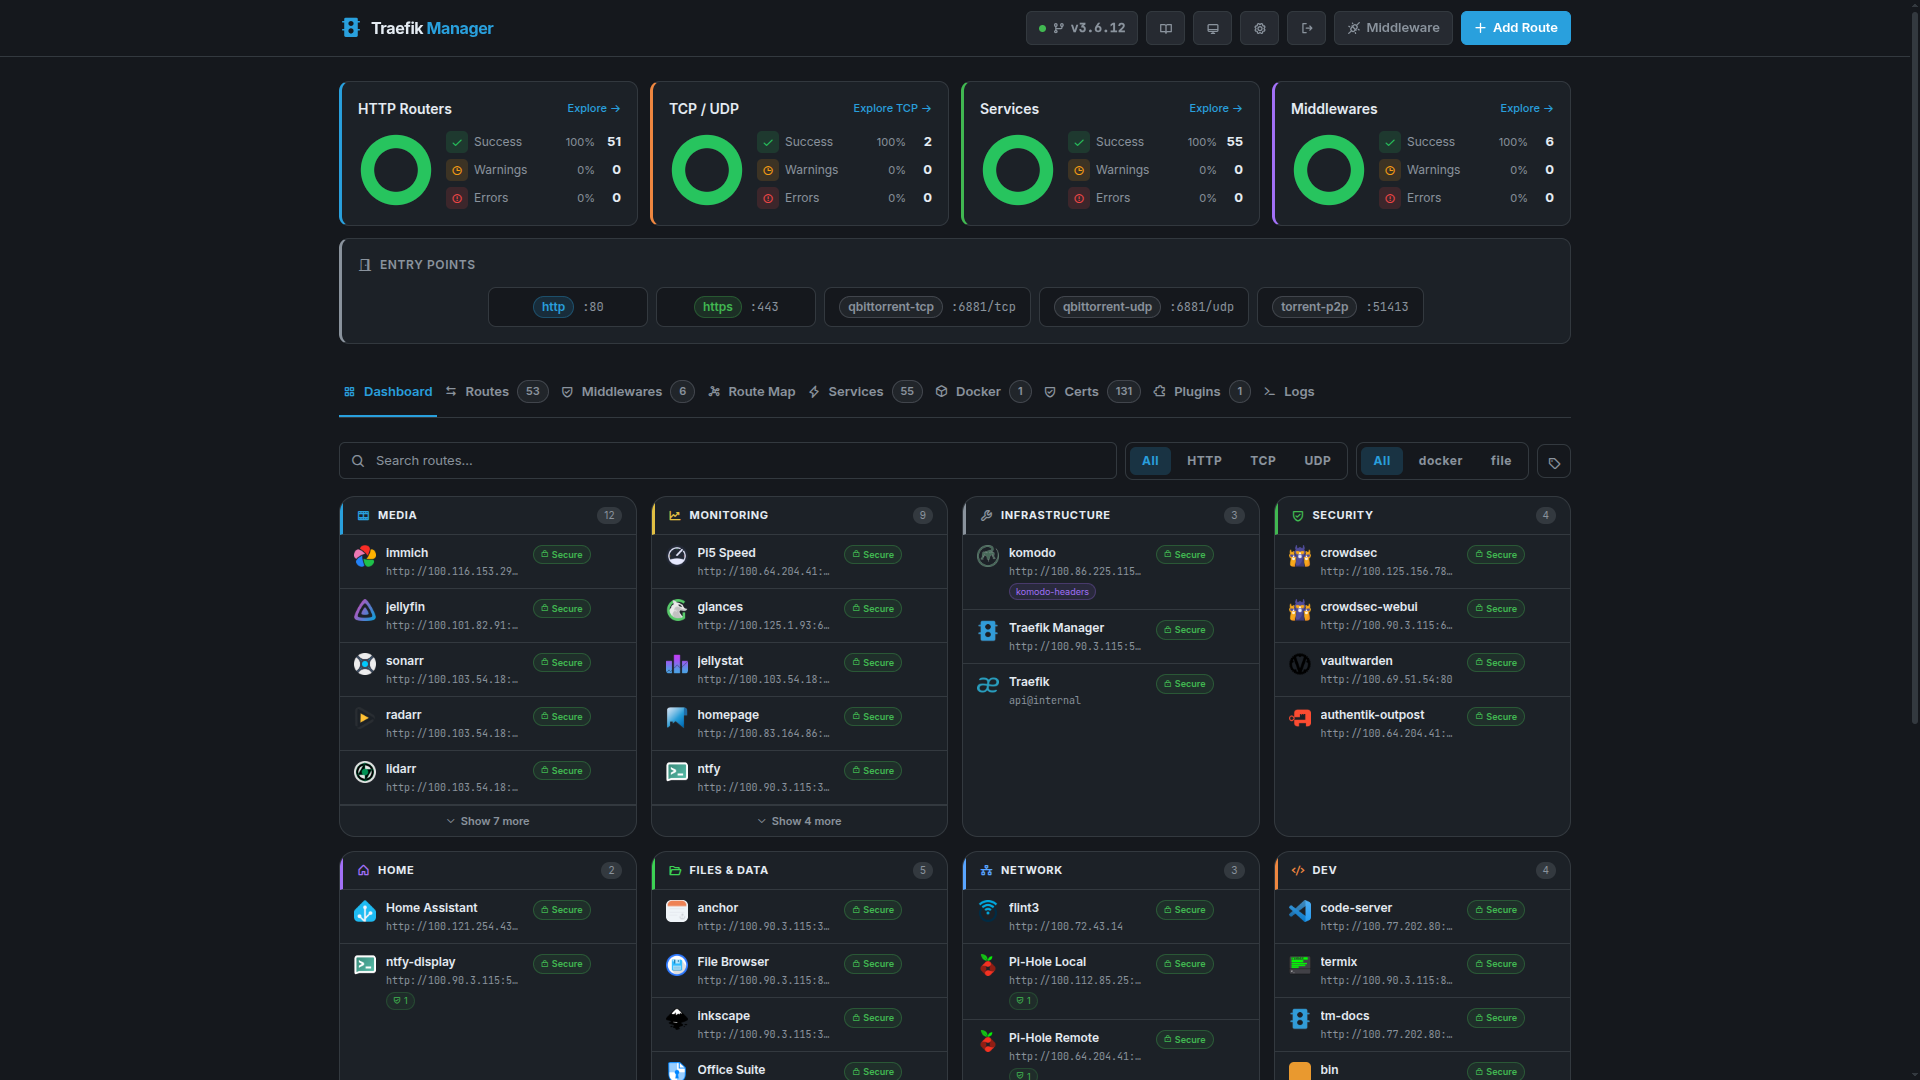
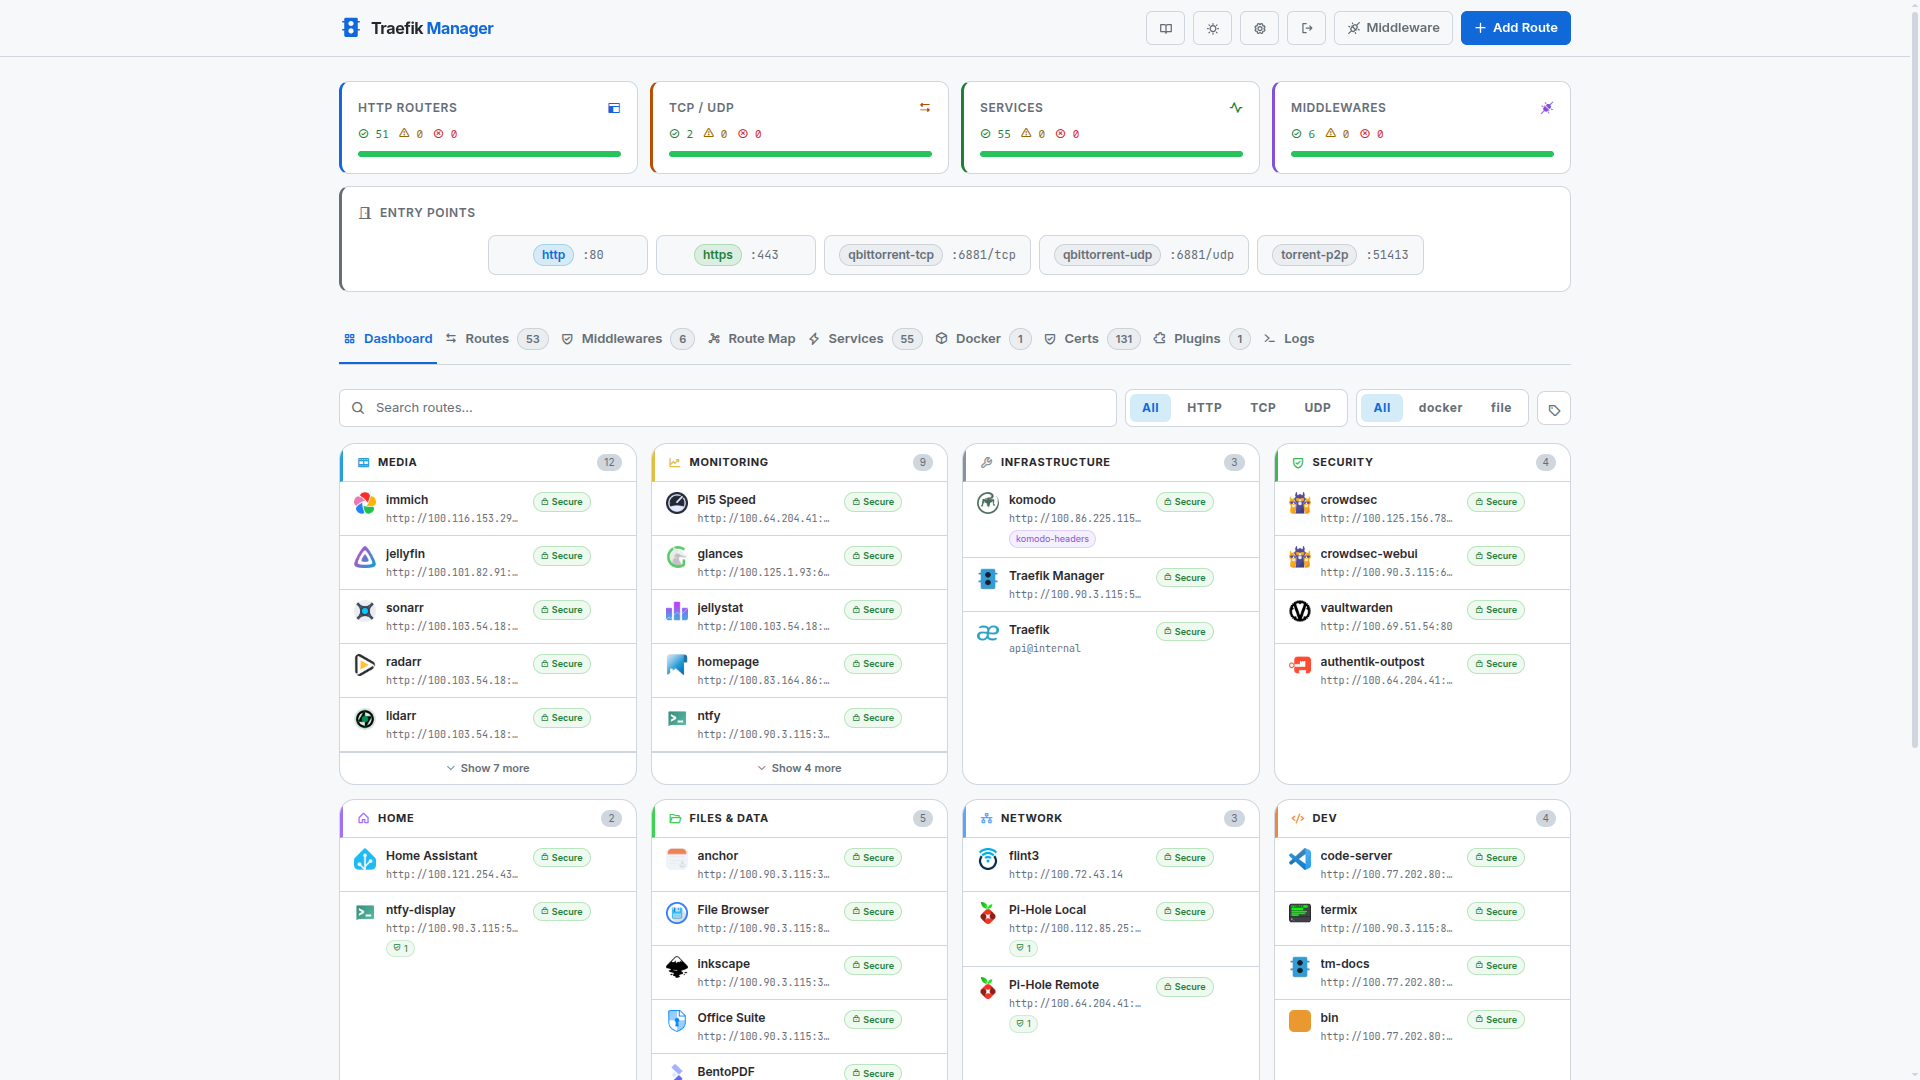
Dashboard
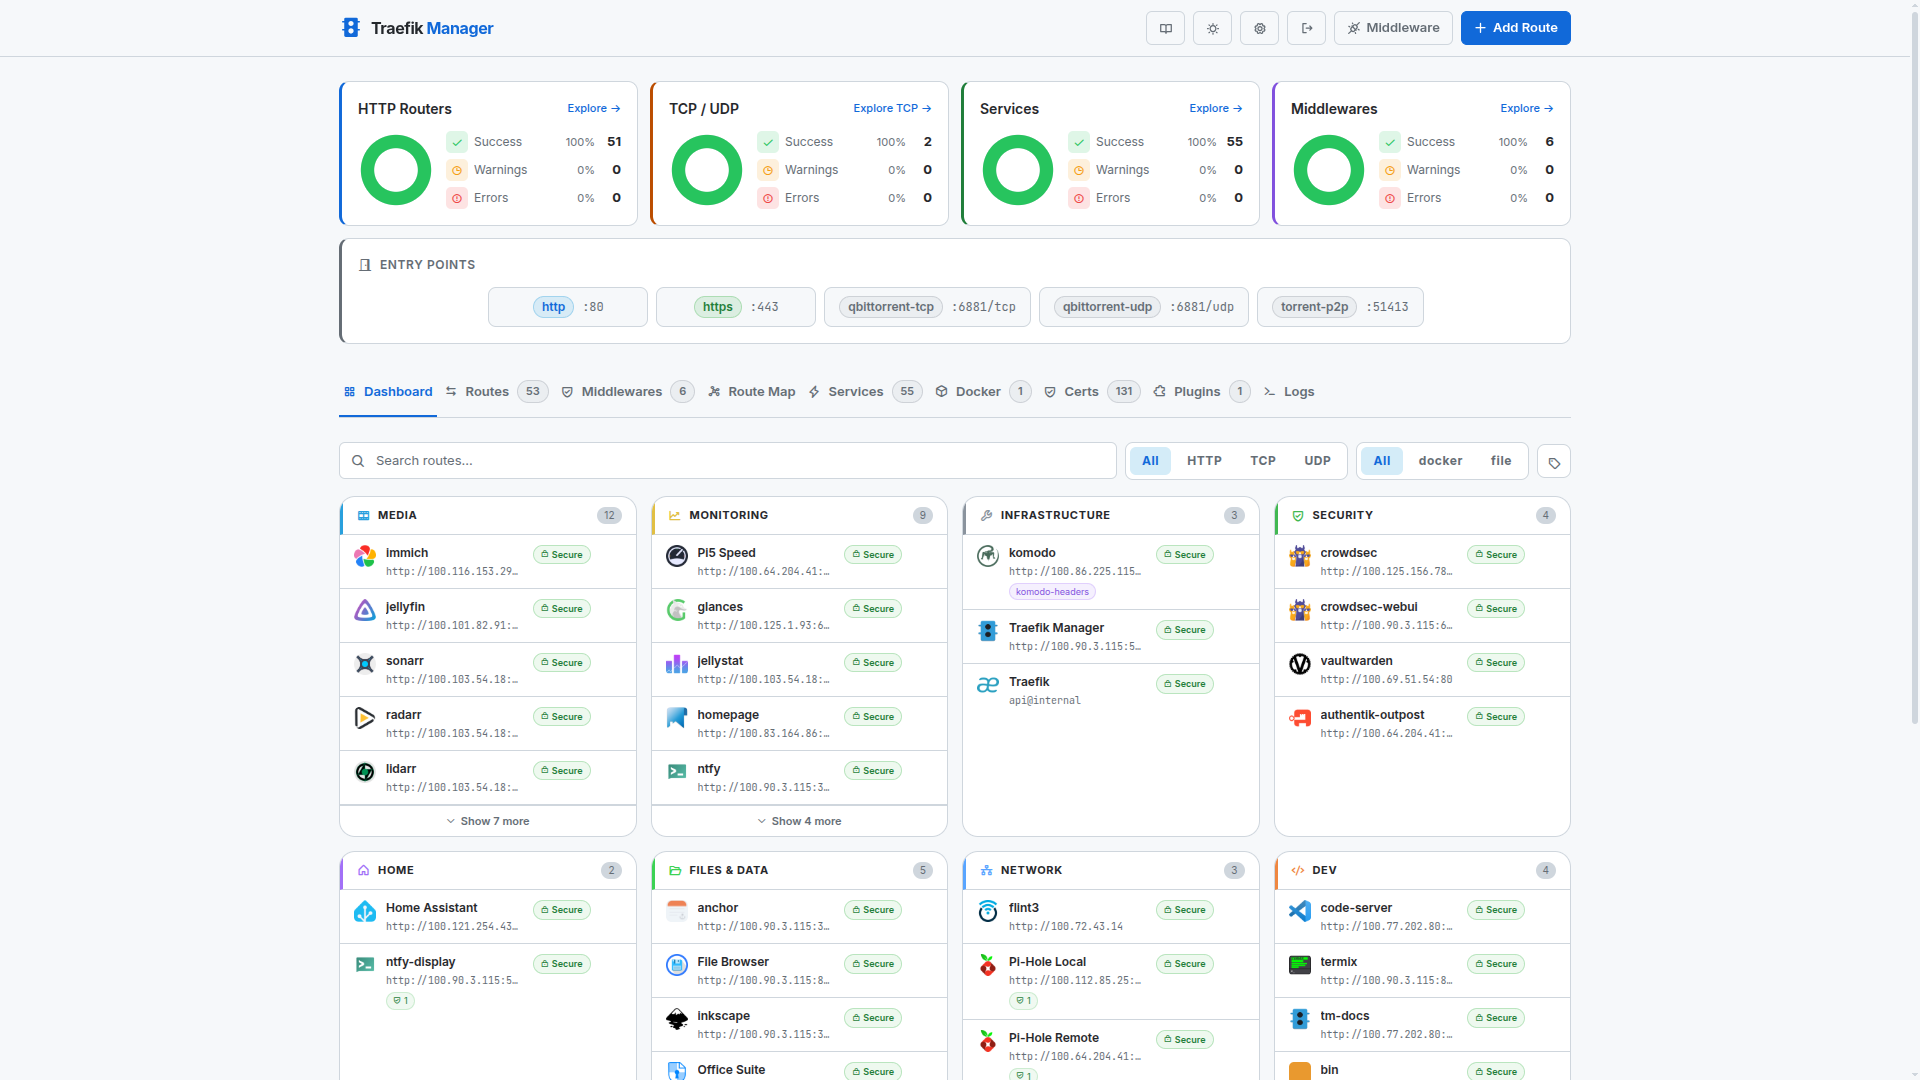
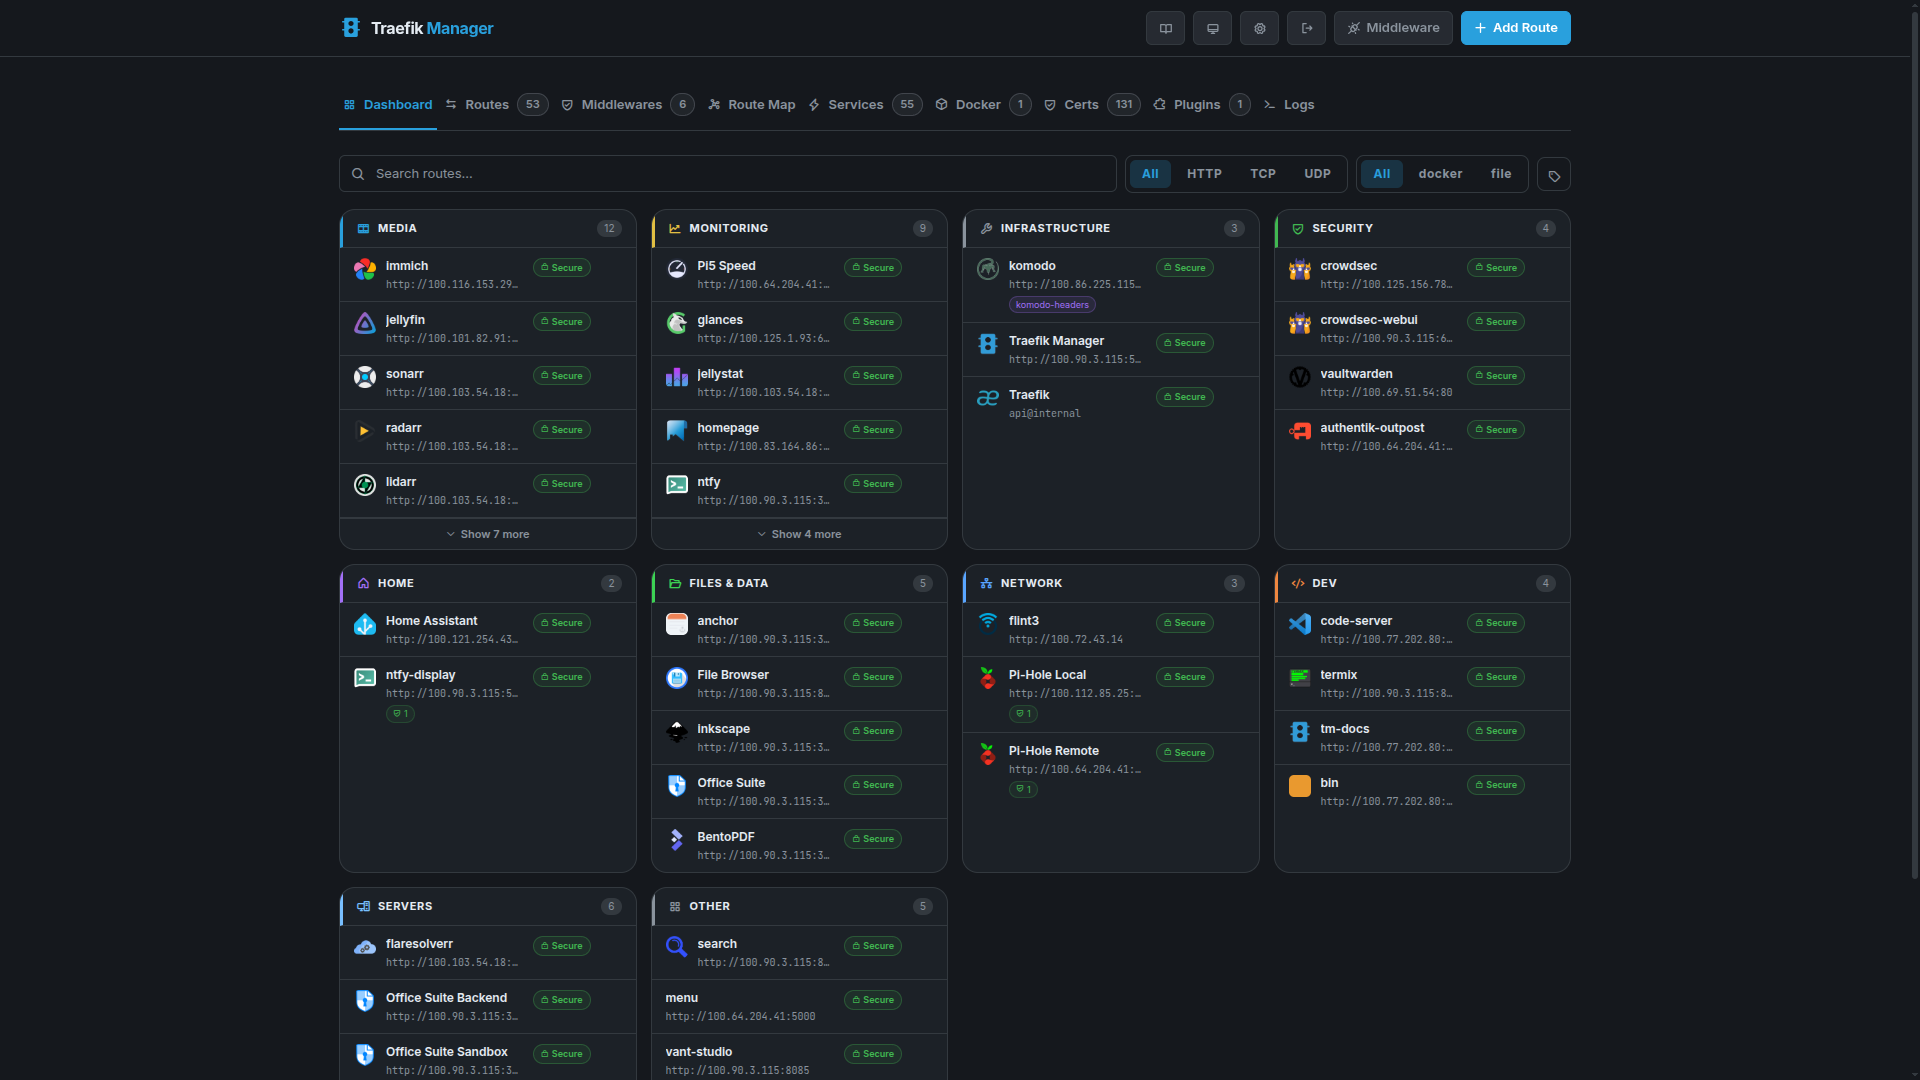
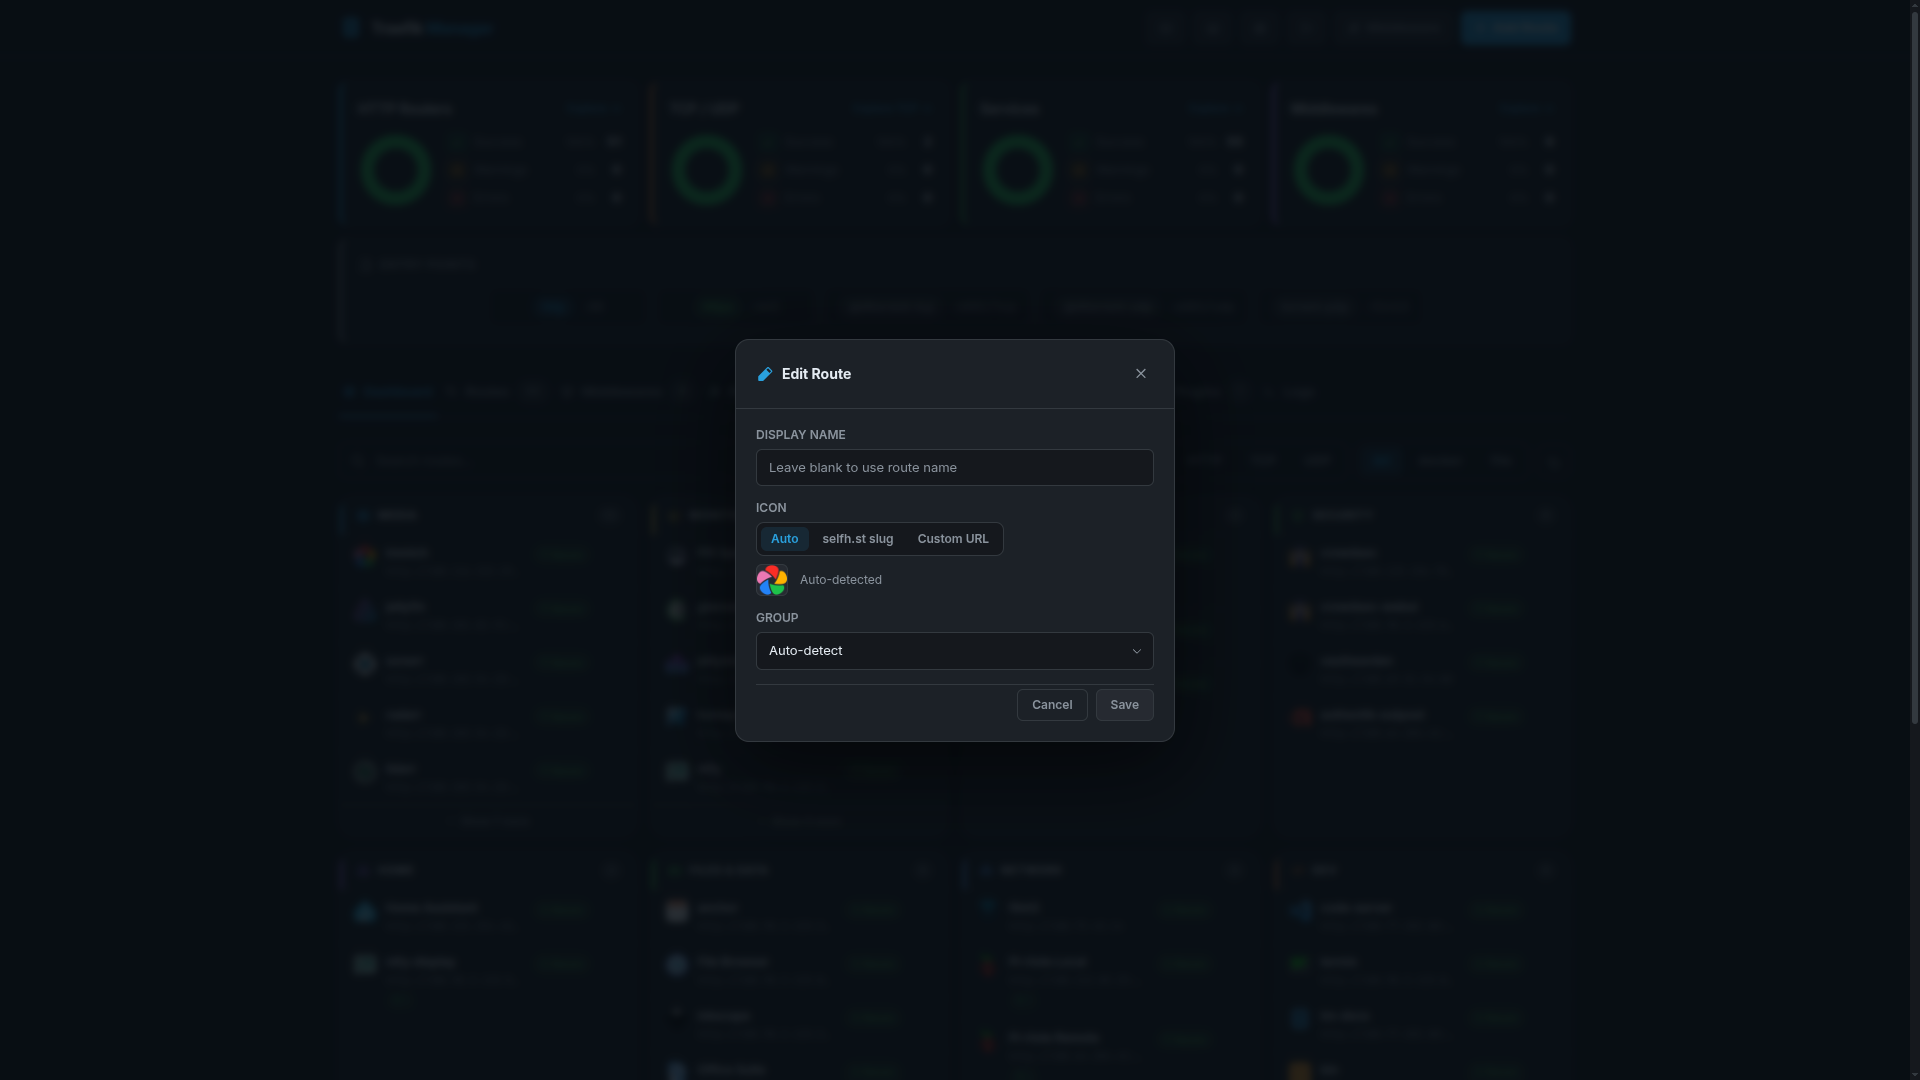
The dashboard shows app cards grouped by category with app icons, stat widgets, and quick-access controls. Cards can be customised per-route with a display name, icon override, and group override.
Main View
Compact Stats
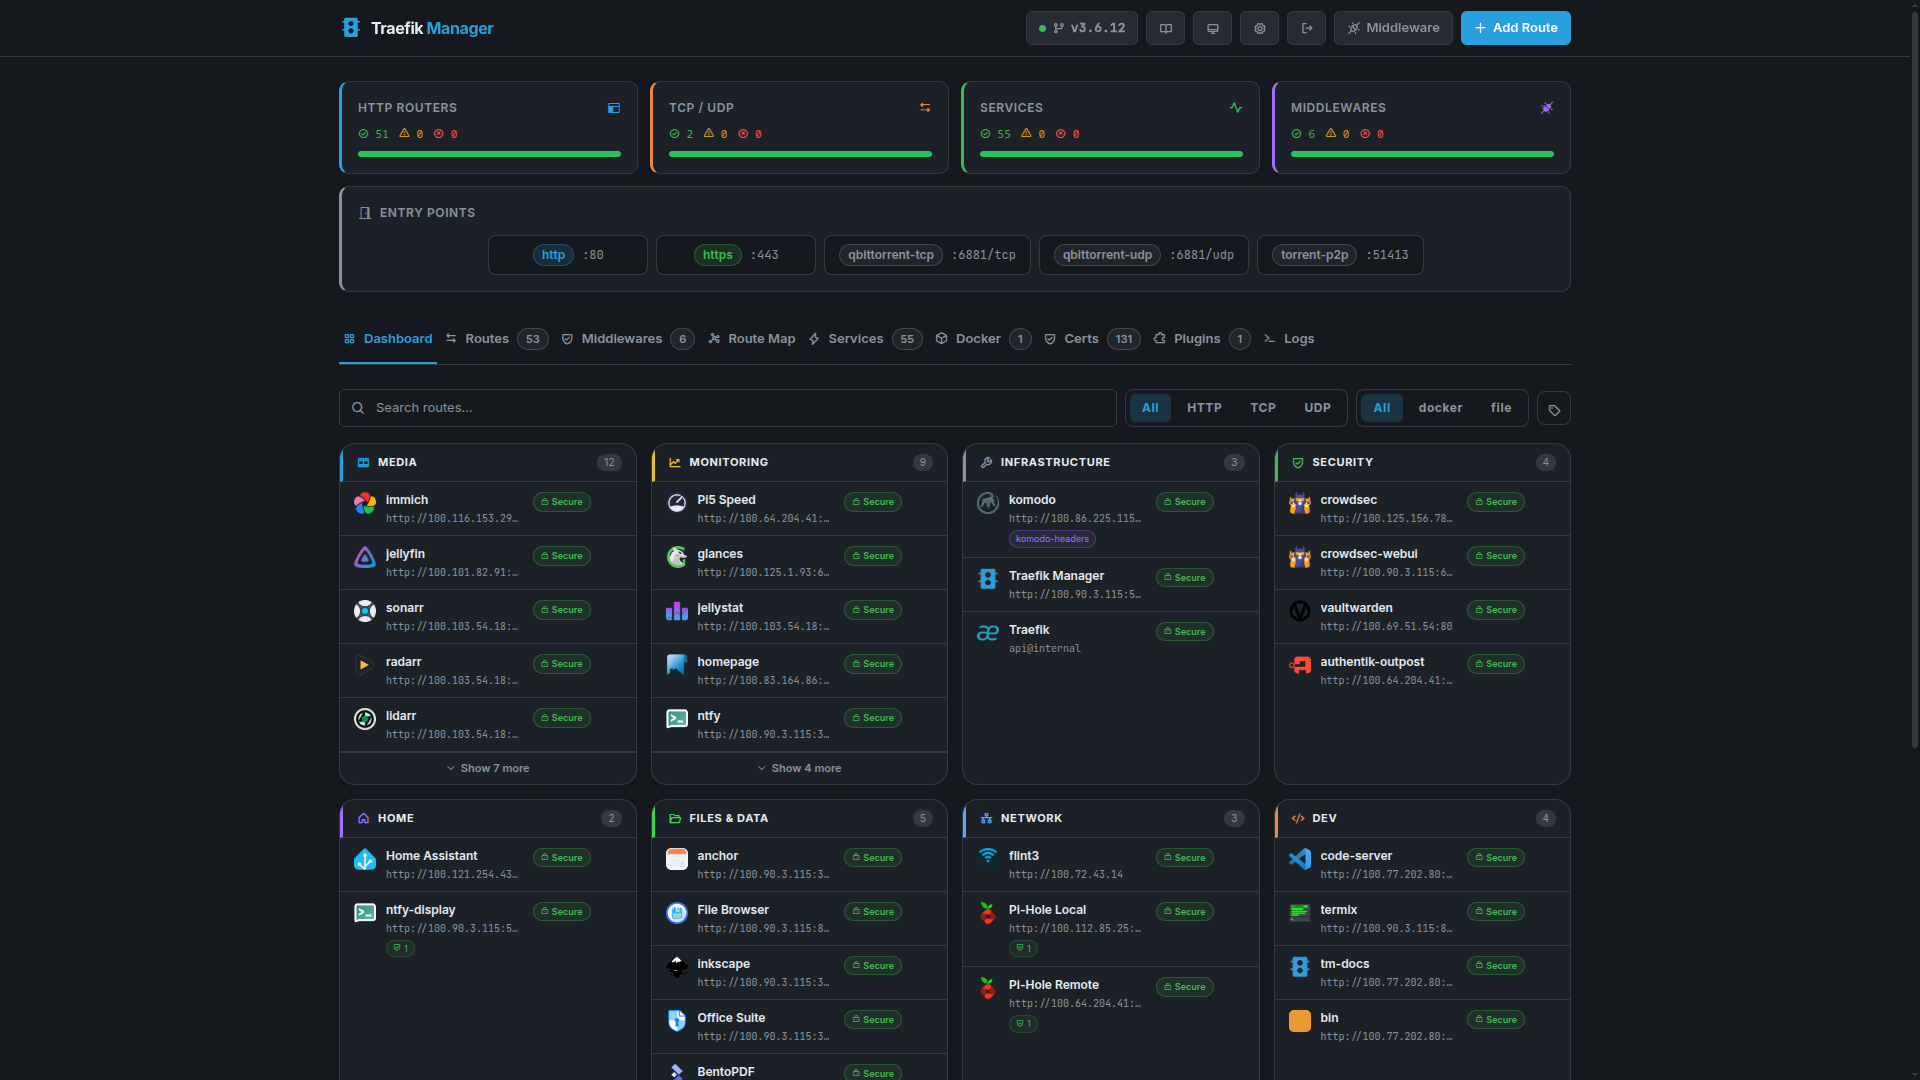
No Widgets
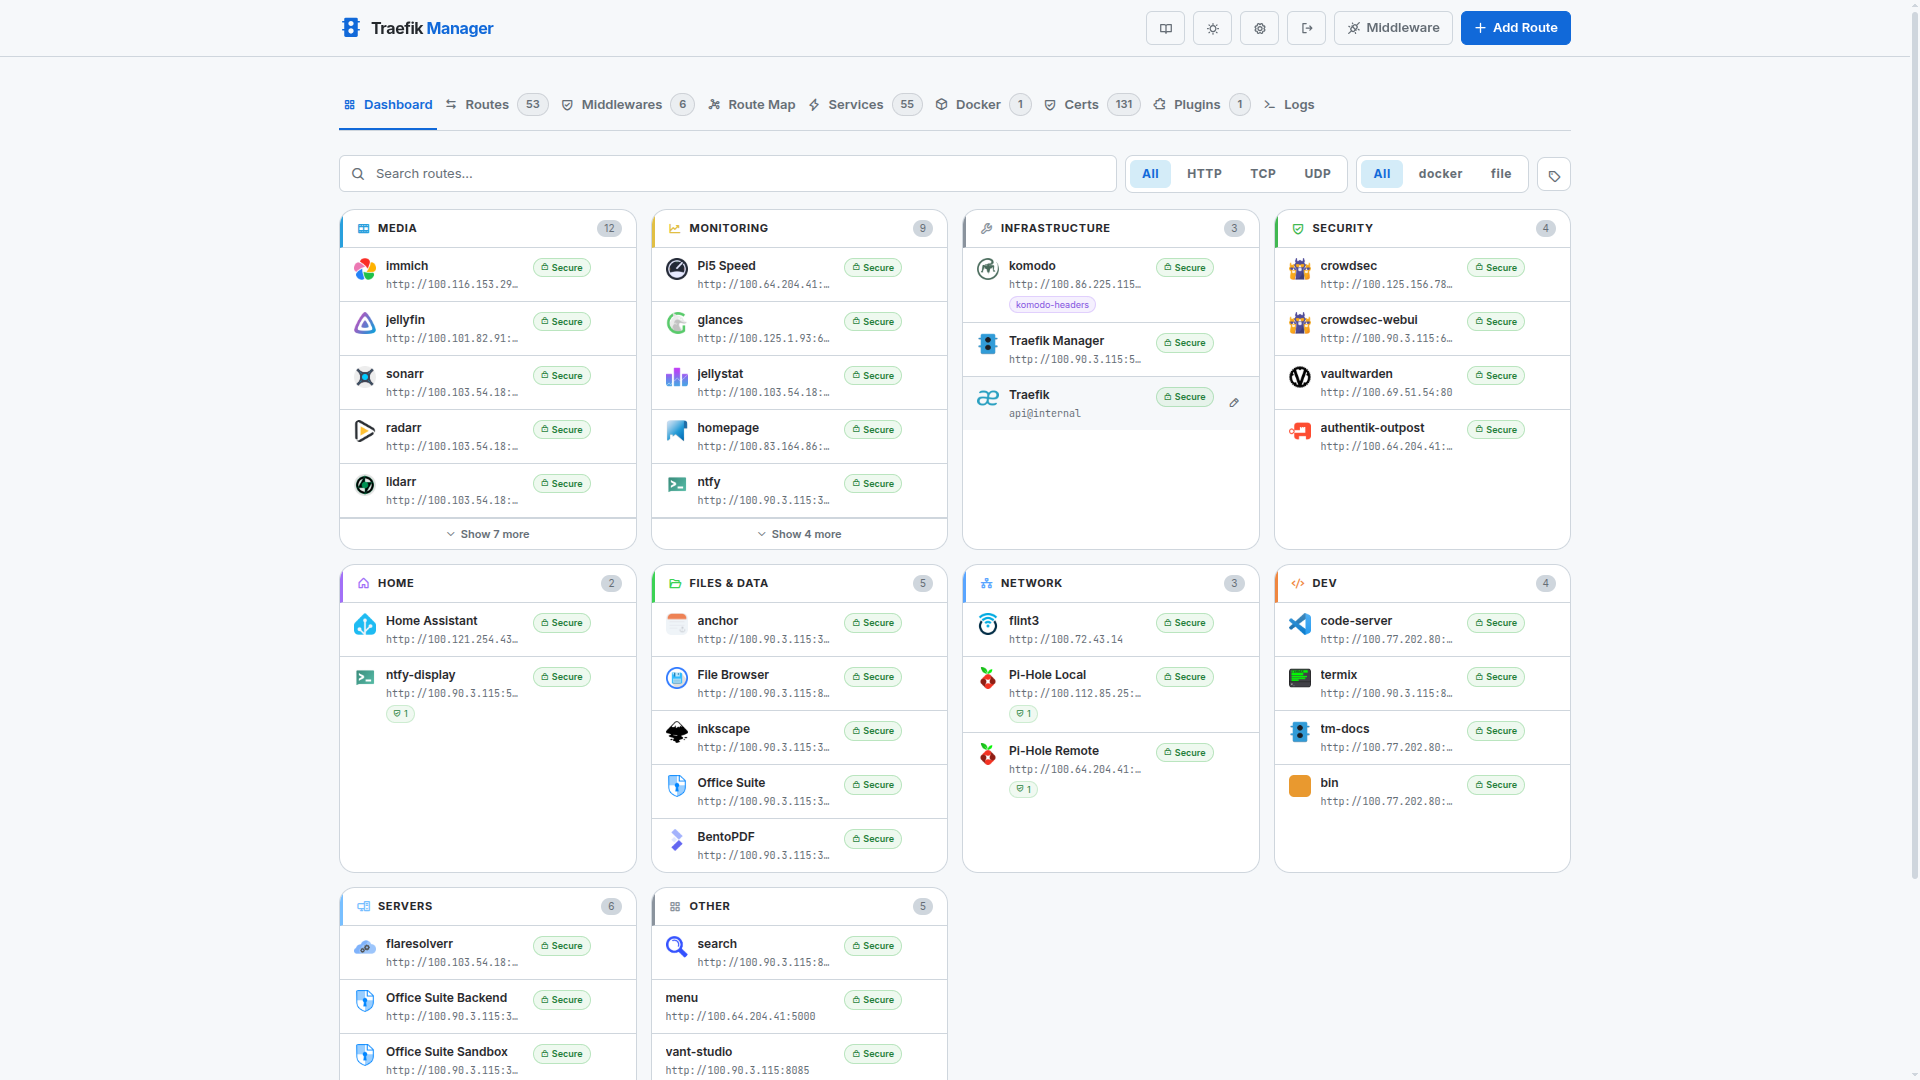
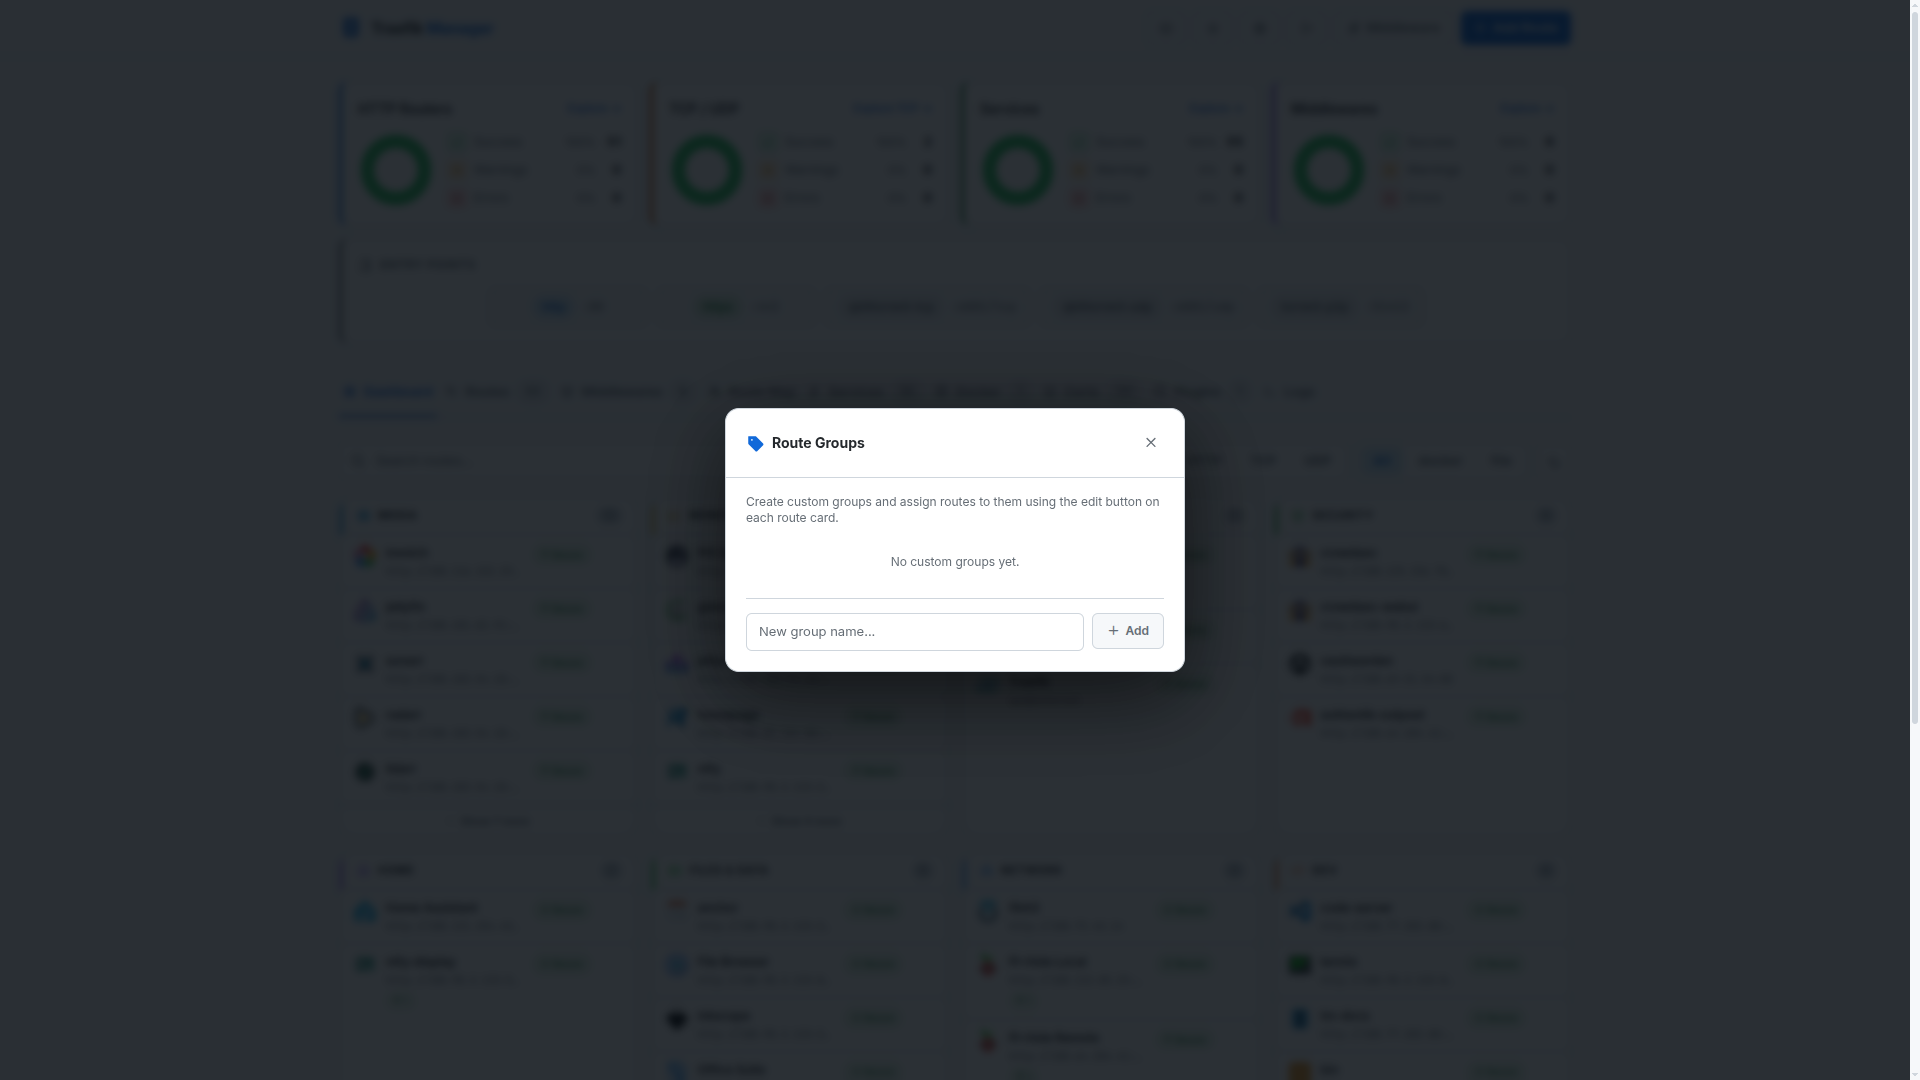
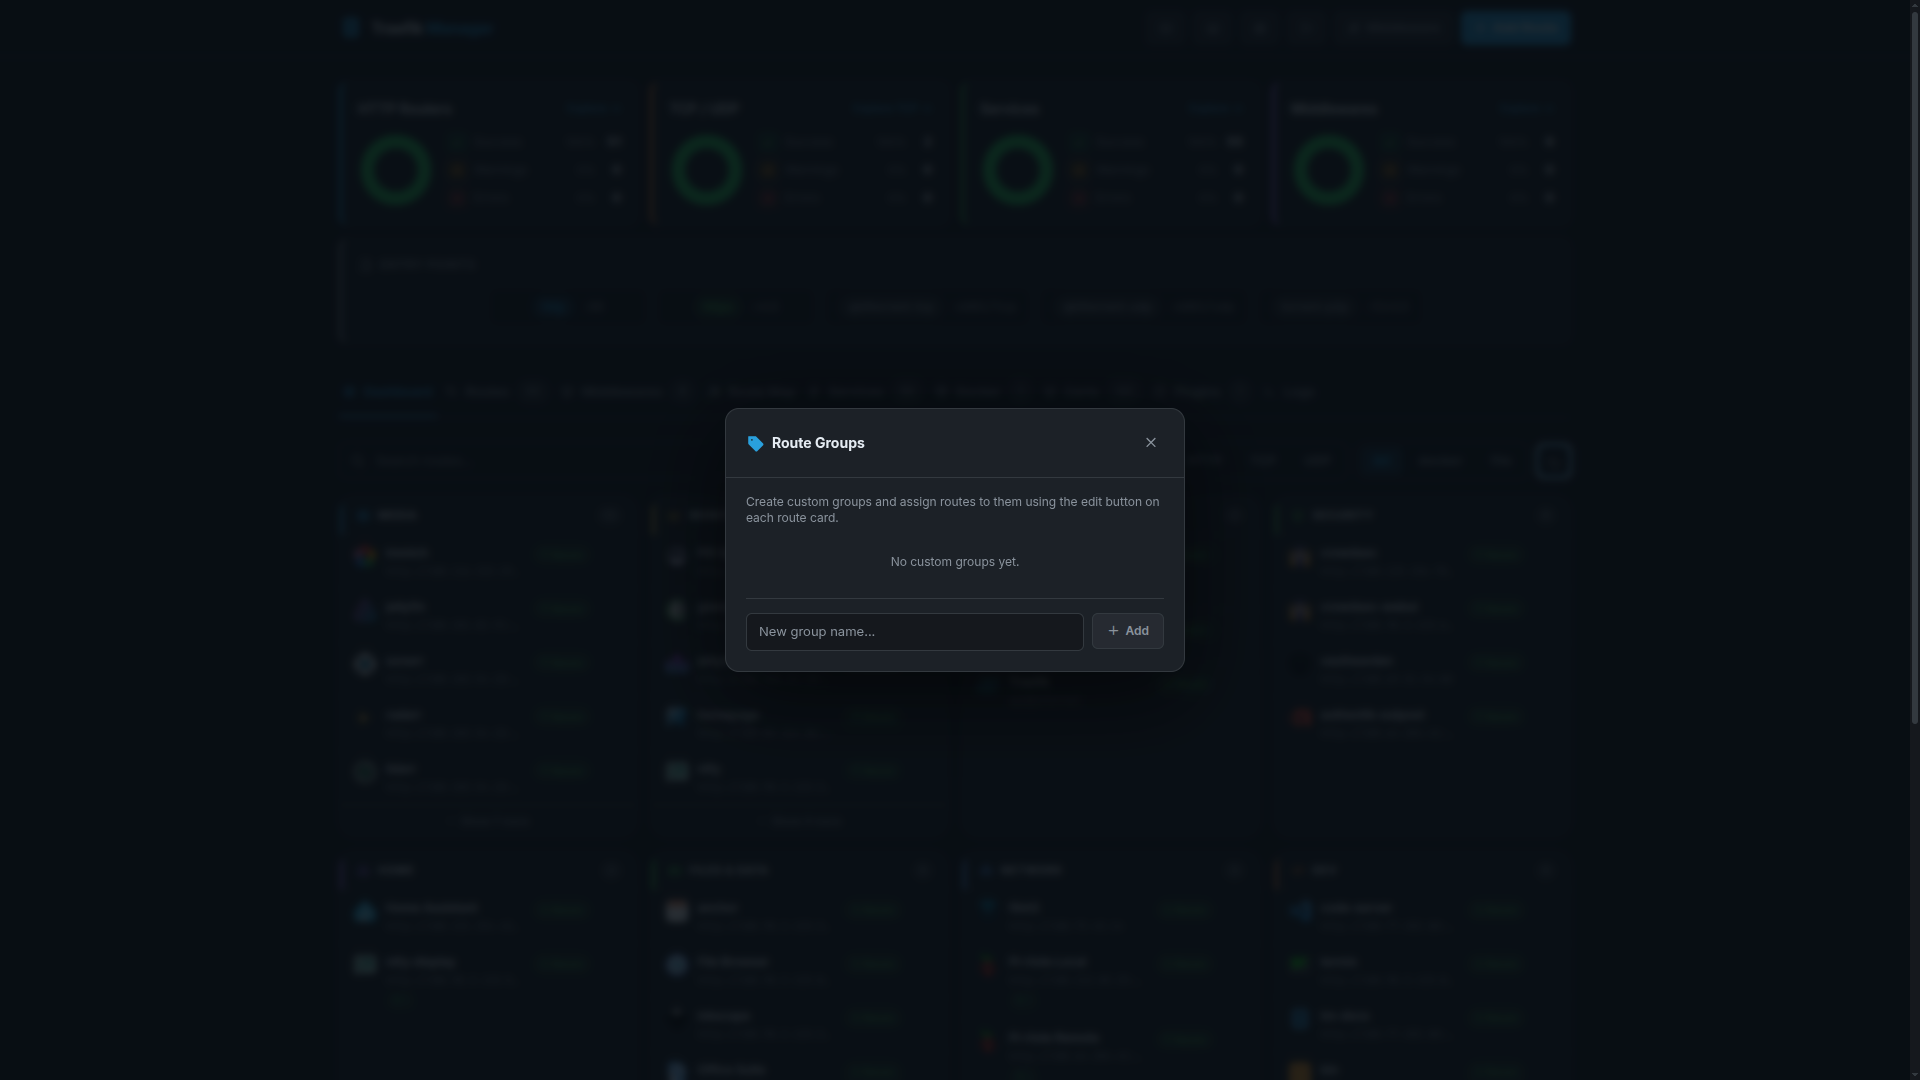
Edit Group
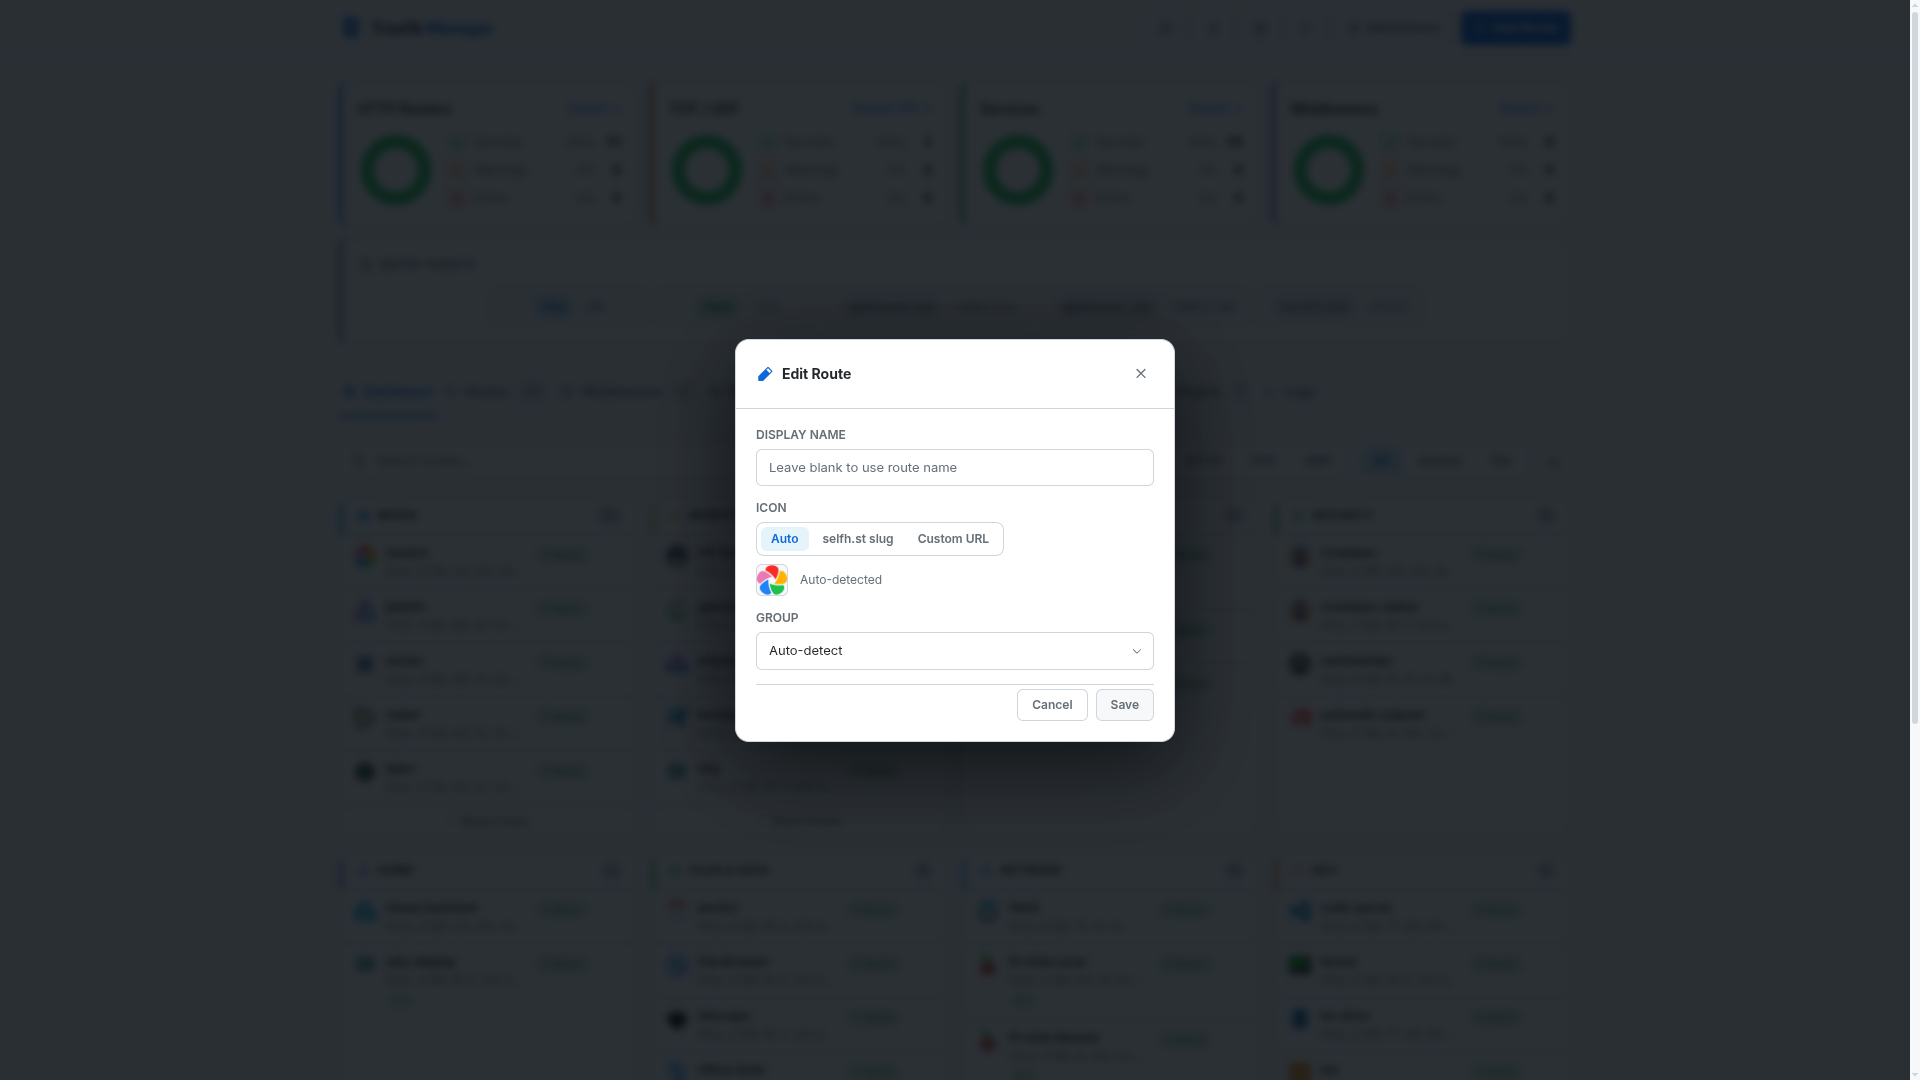
Edit Route Card
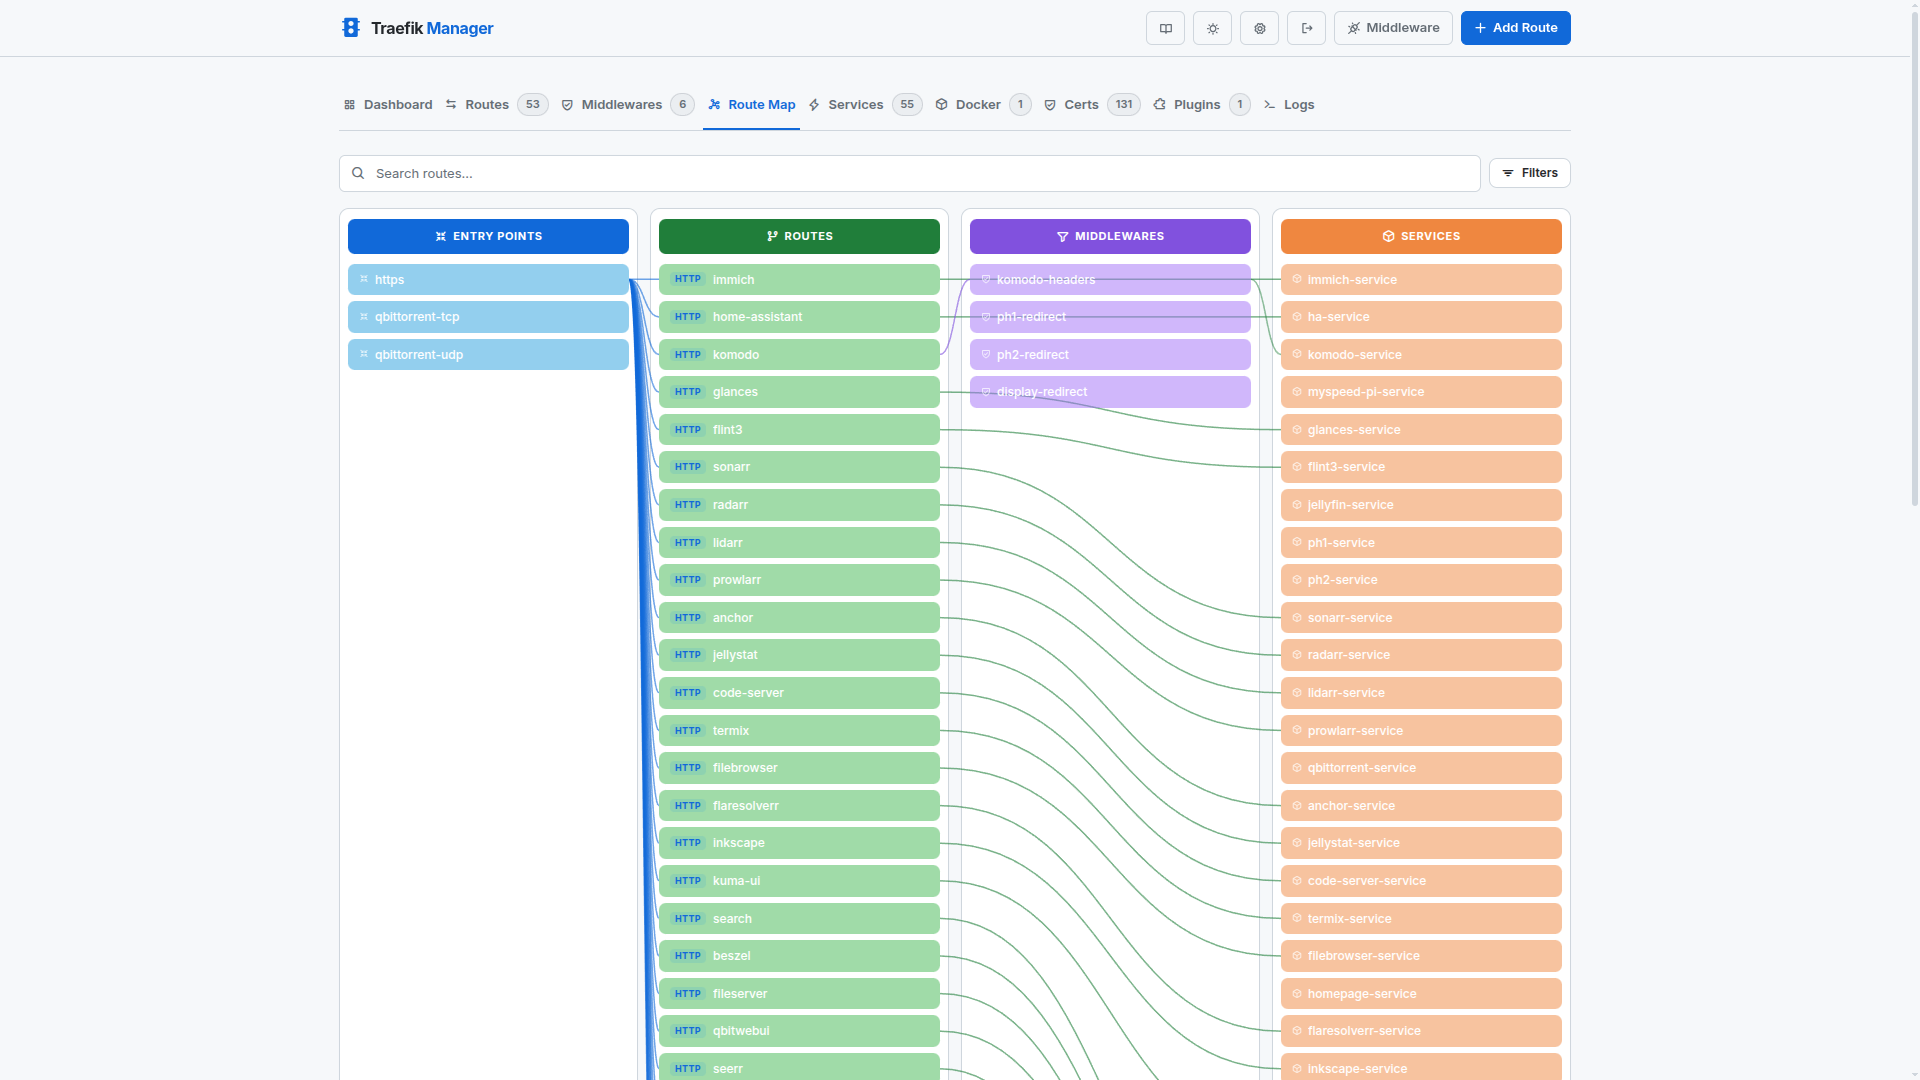
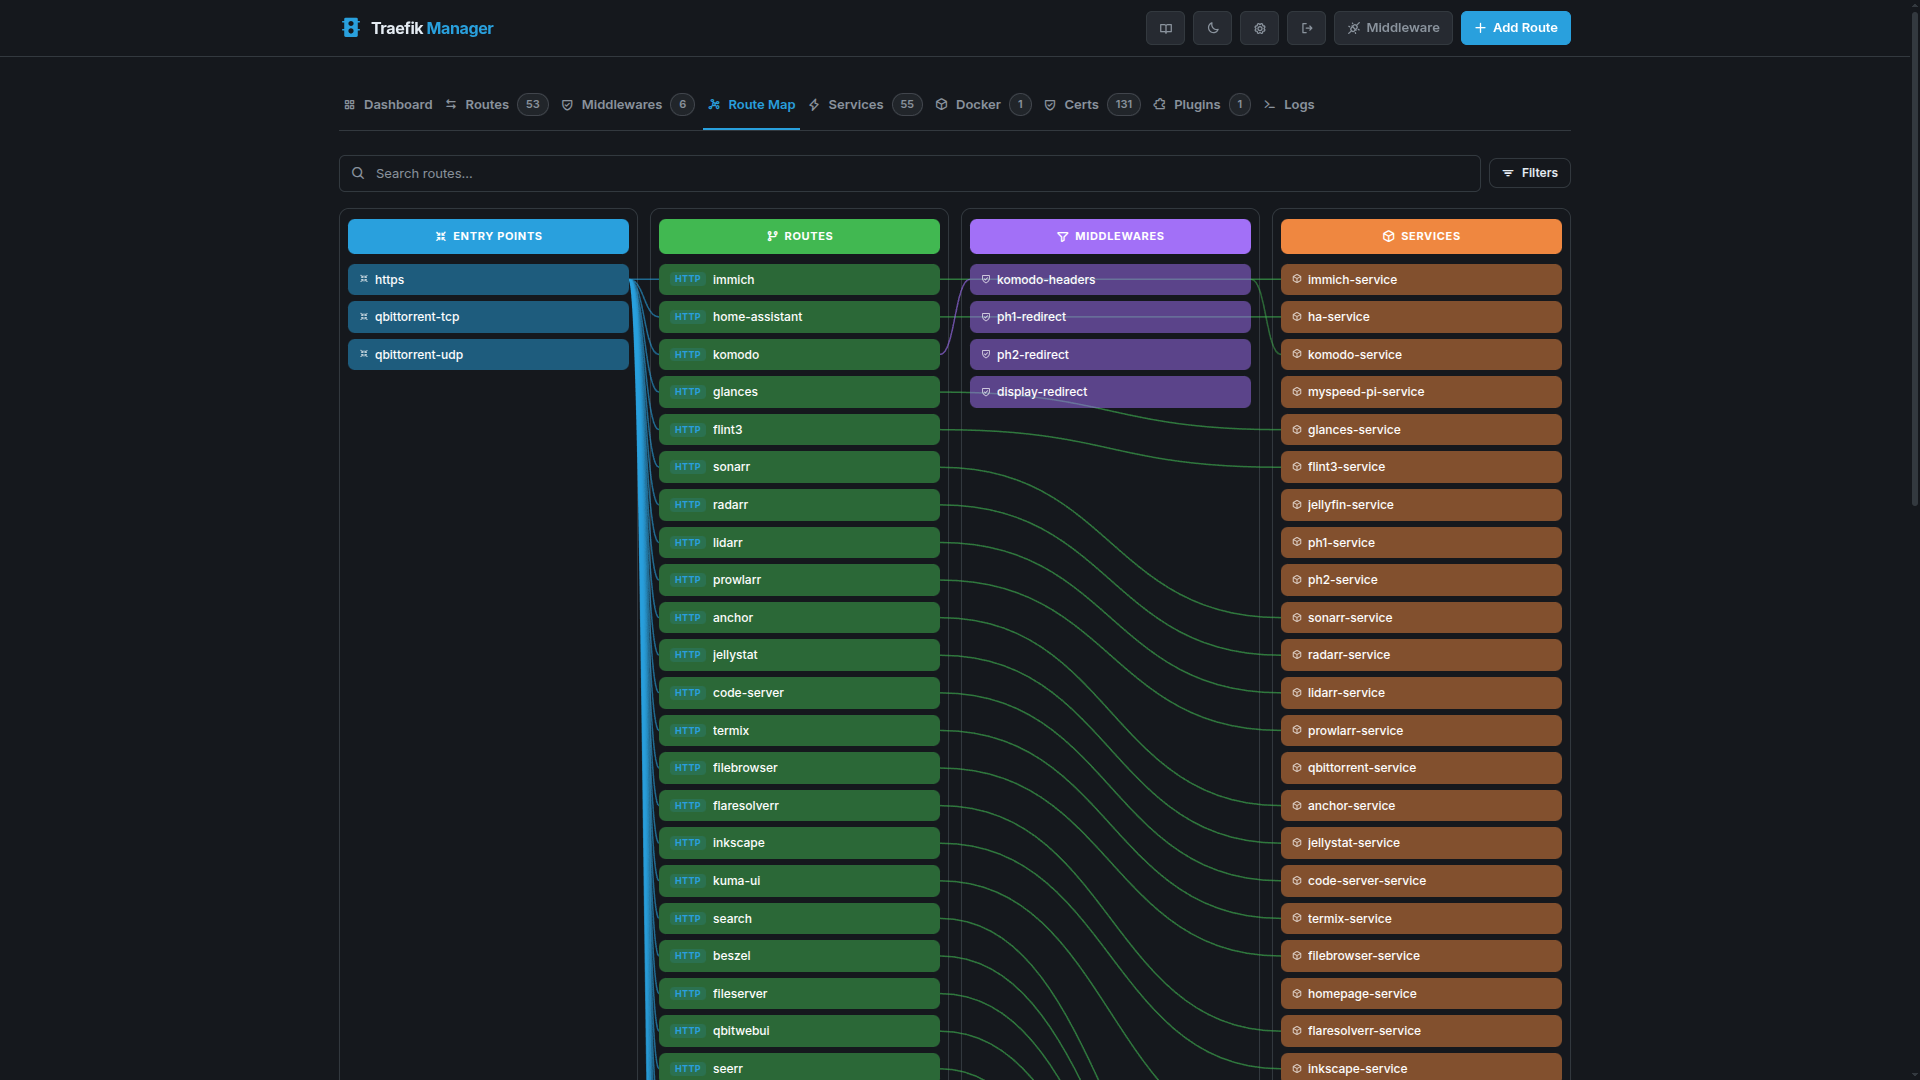
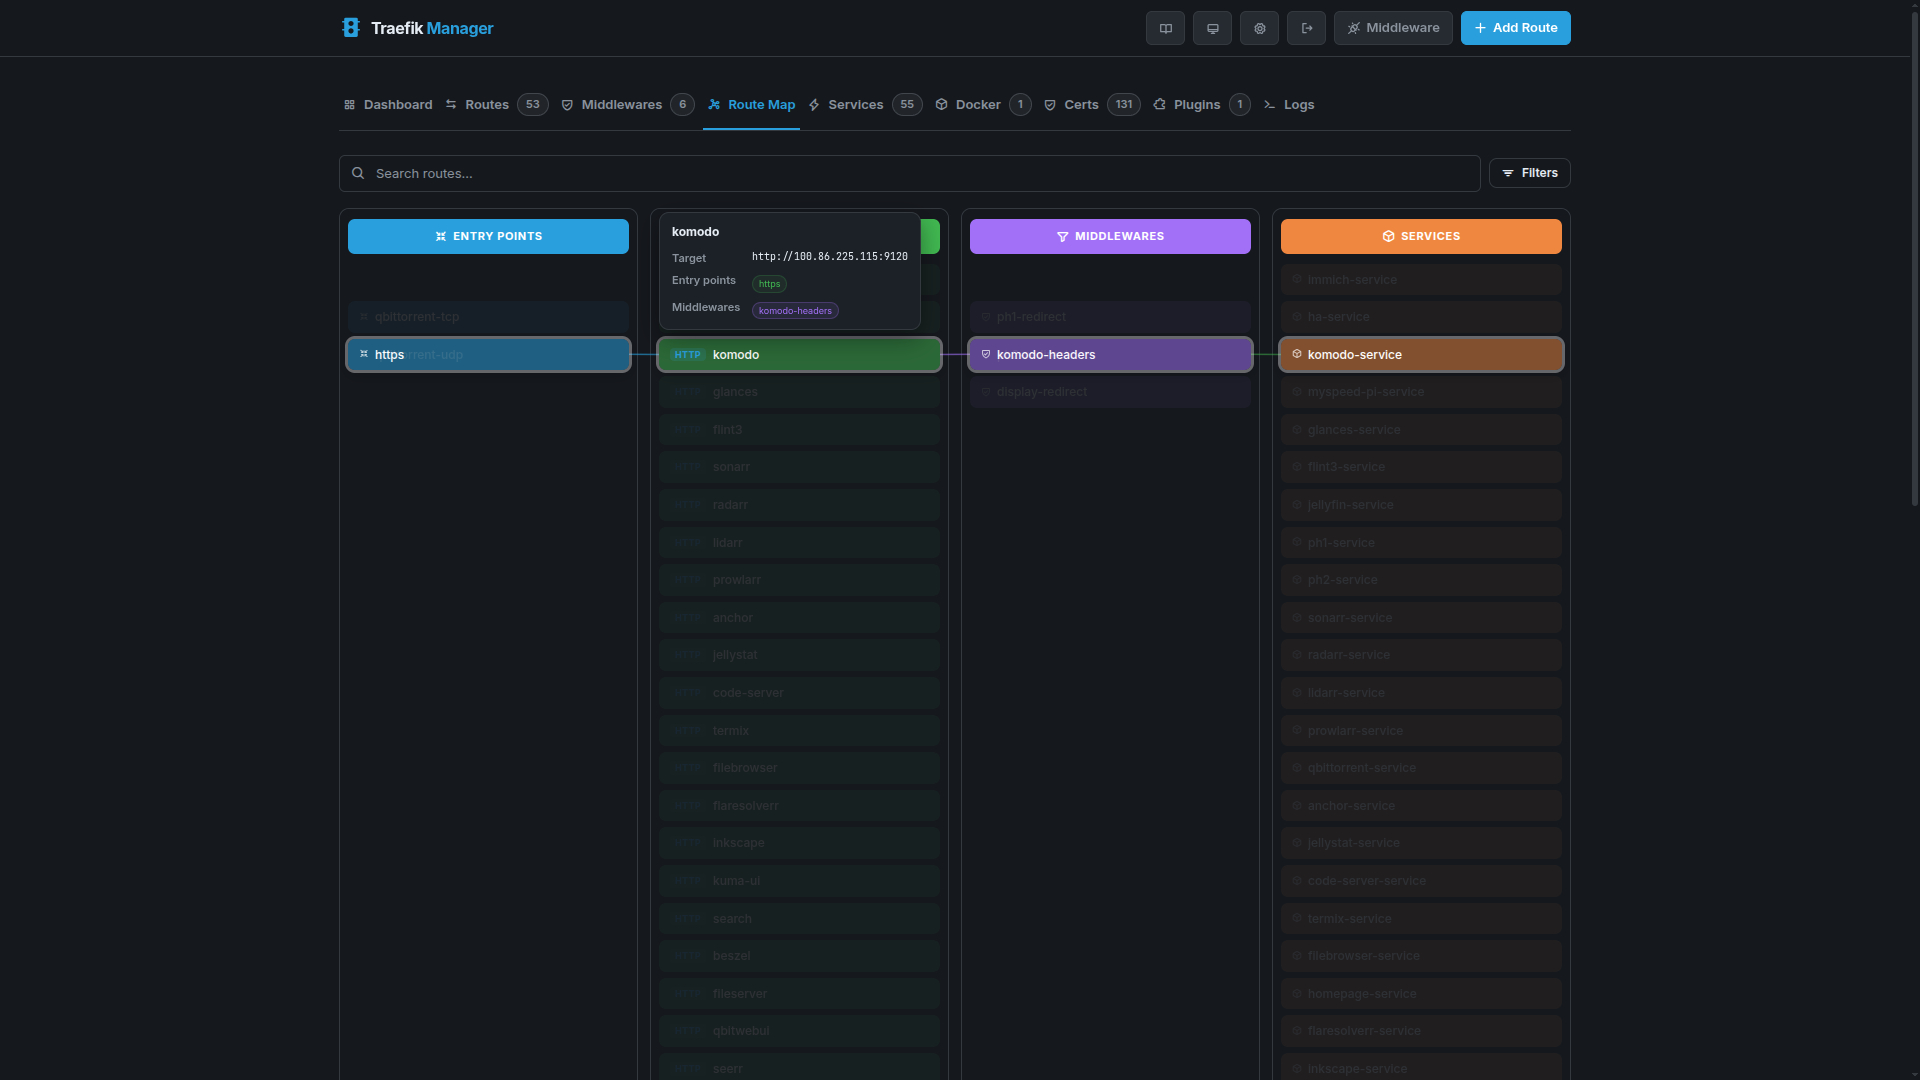
Route Map
The Route Map tab shows a 4-column topology view of your Traefik setup - Entry Points, Routes, Middlewares, and Services - connected by Bezier curves.
Topology View
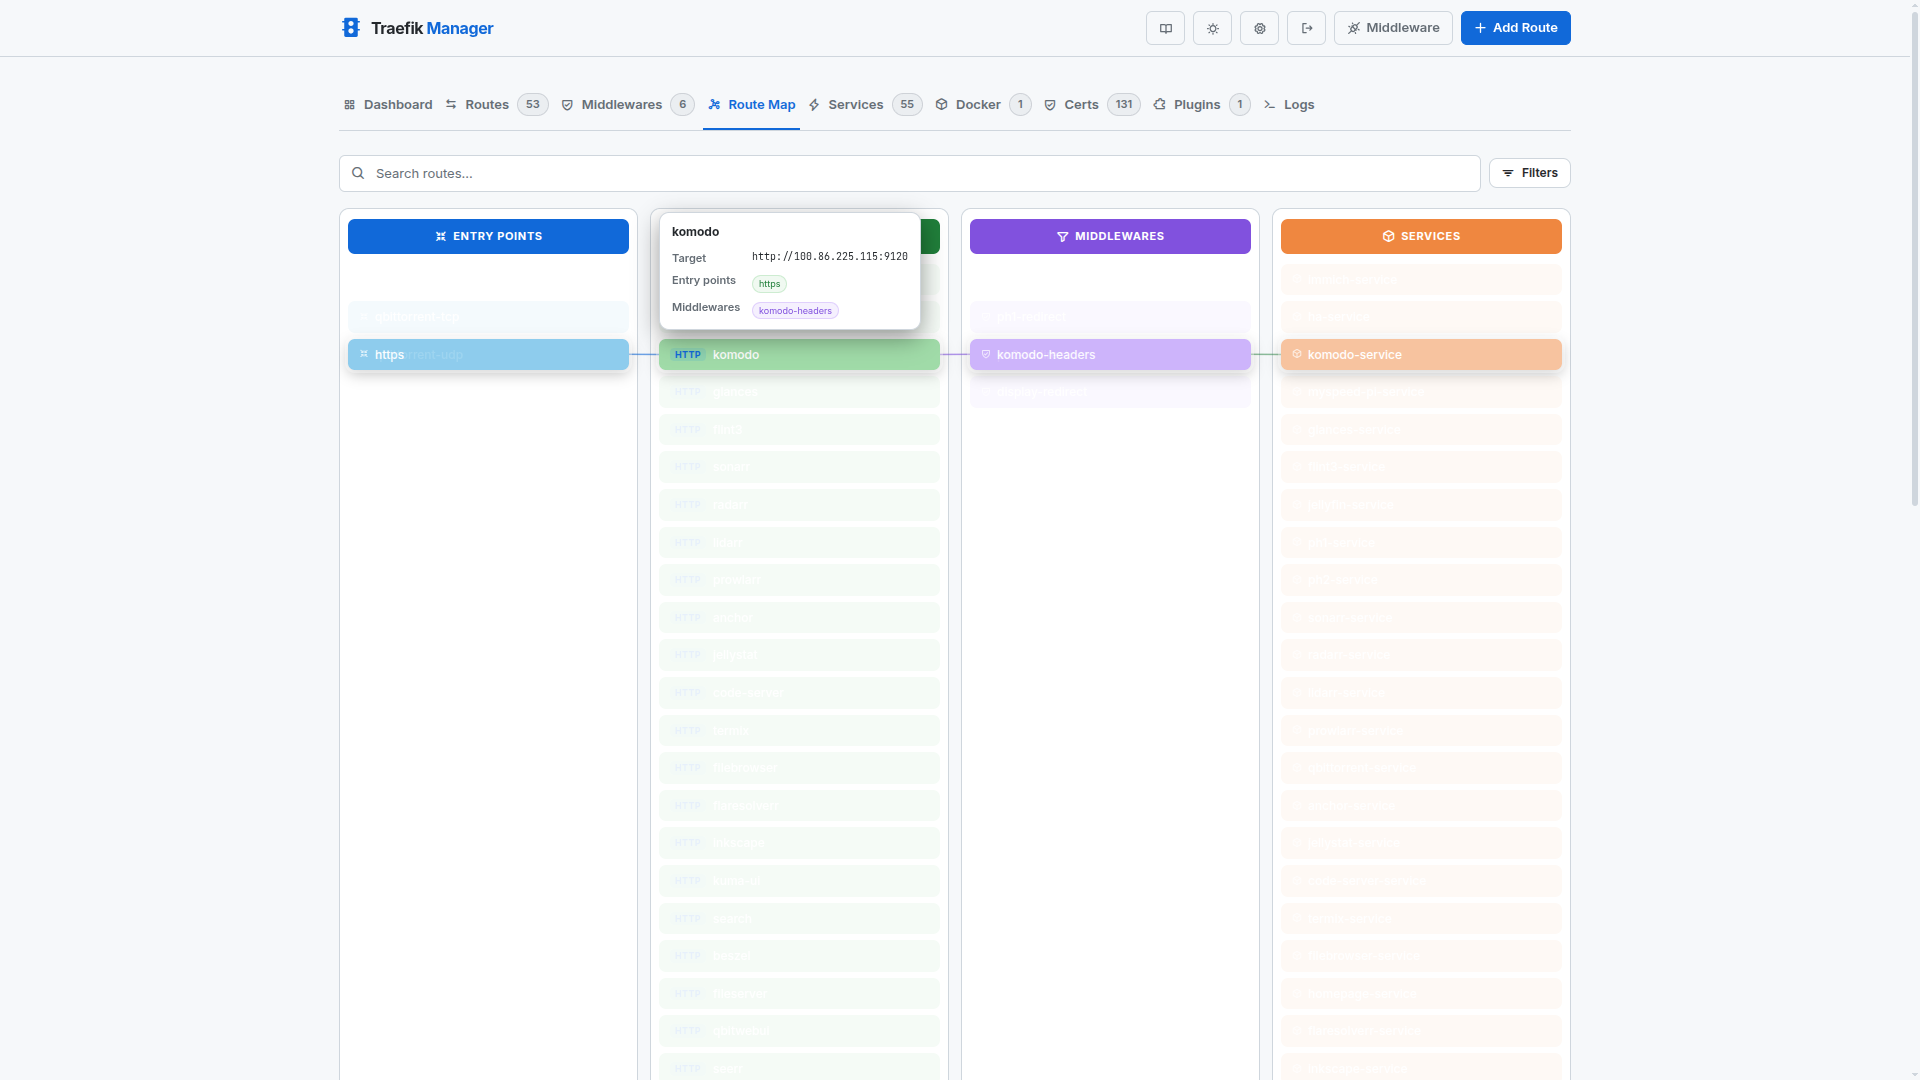
Hover Highlight
Hovering a route dims all unrelated nodes and animates the connected entry point, middlewares, and service into alignment.
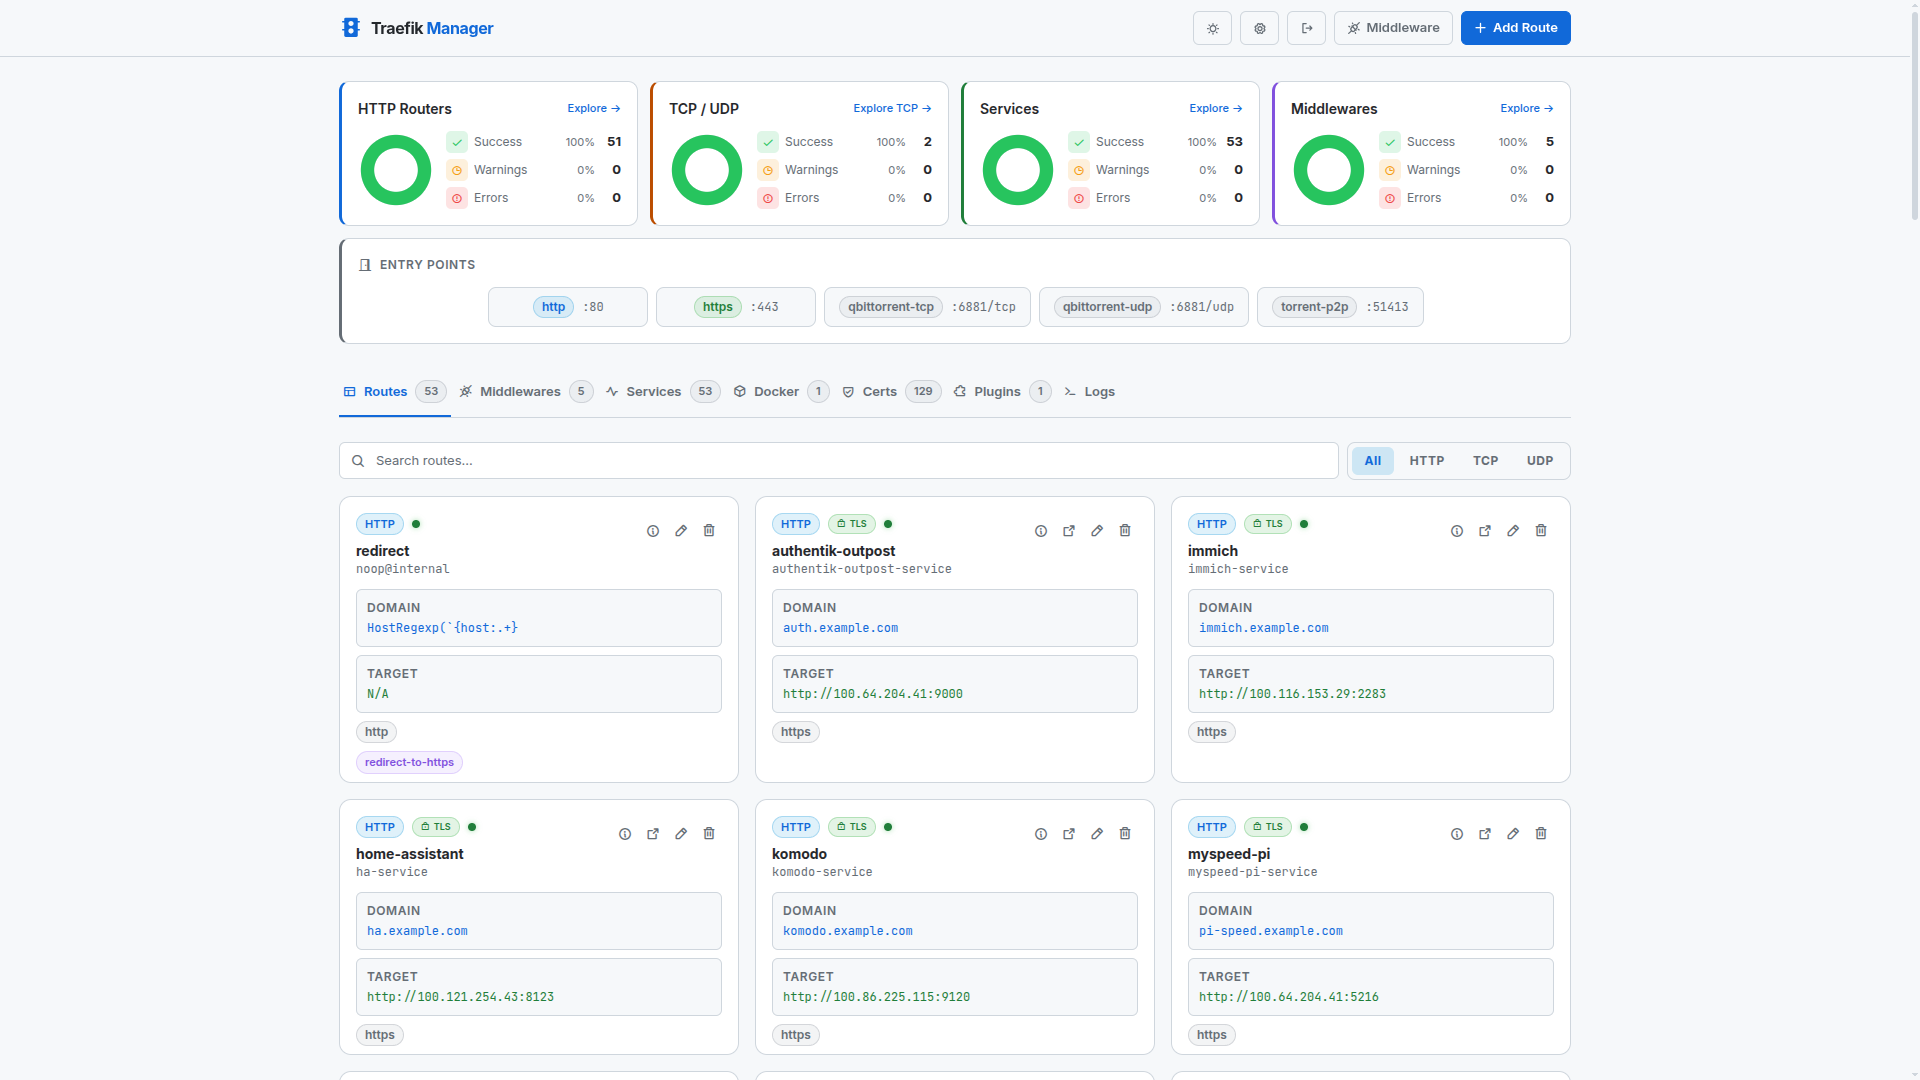
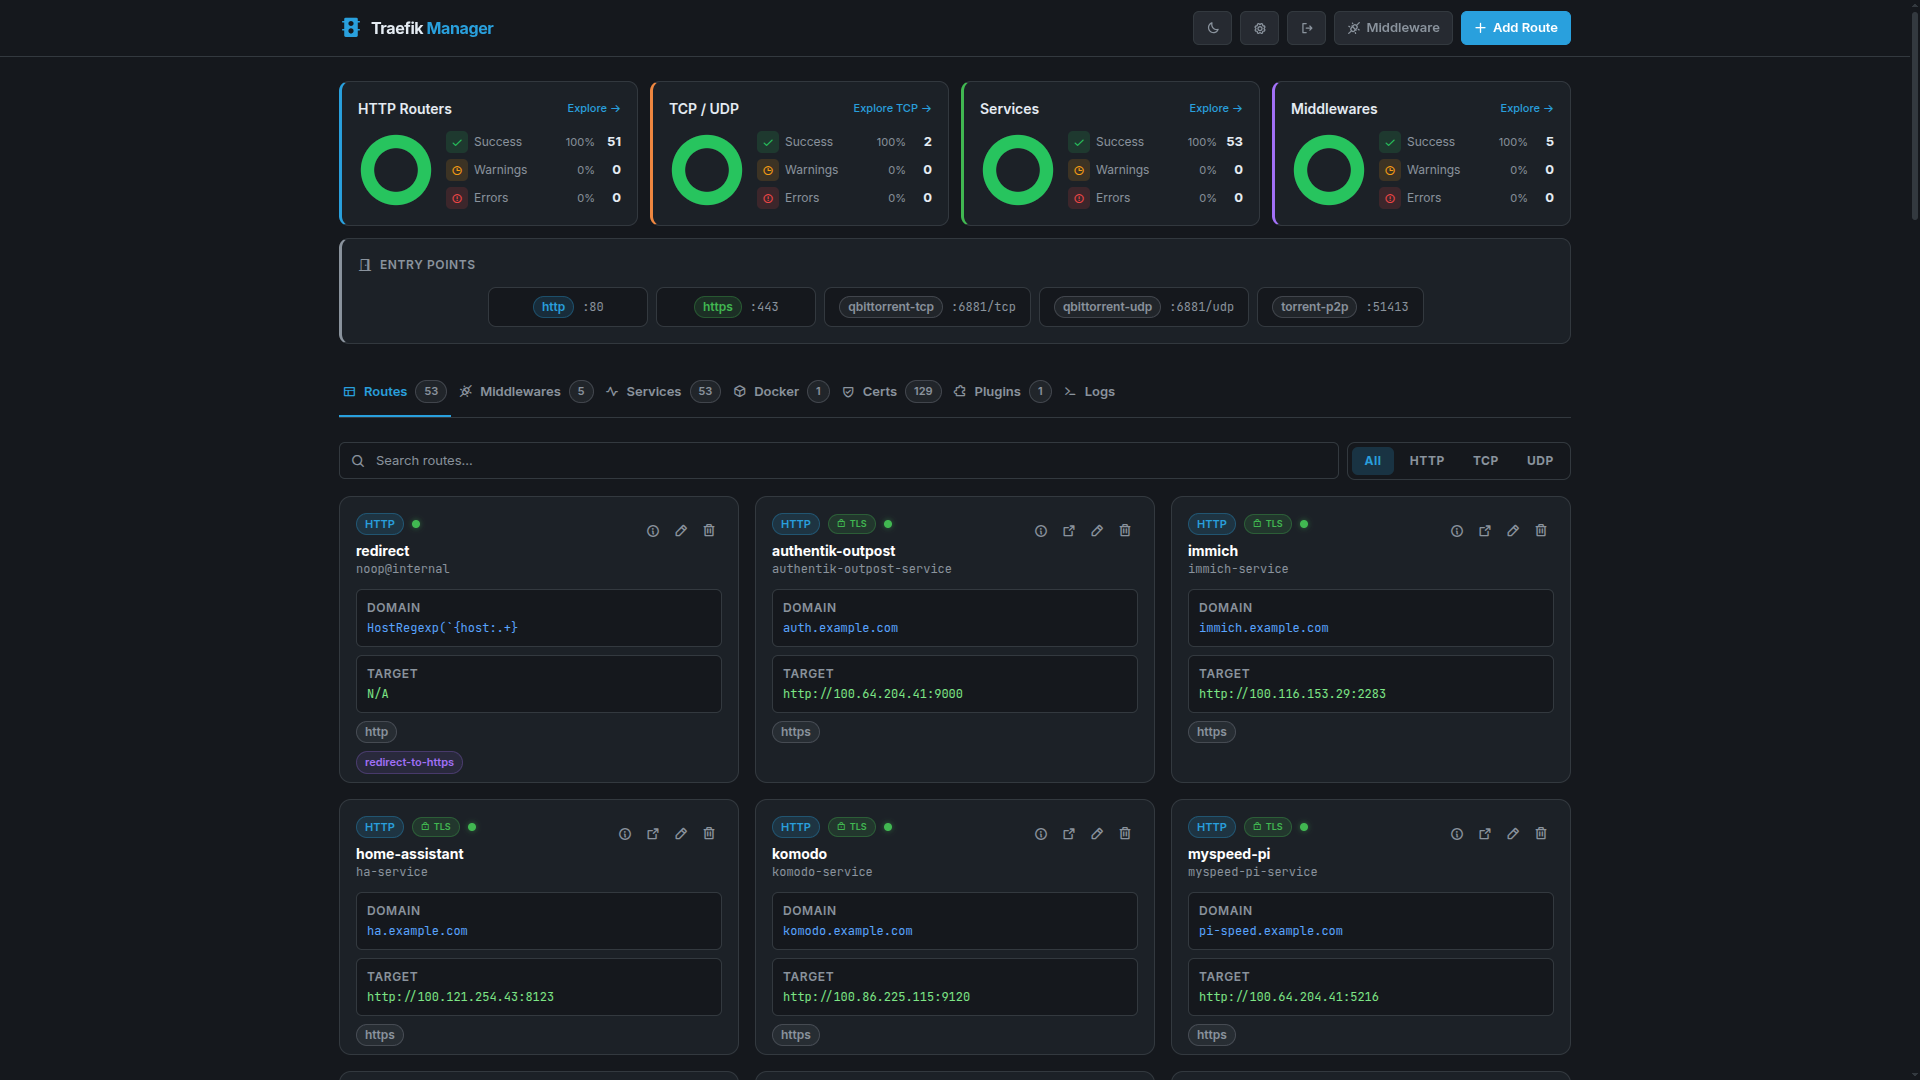
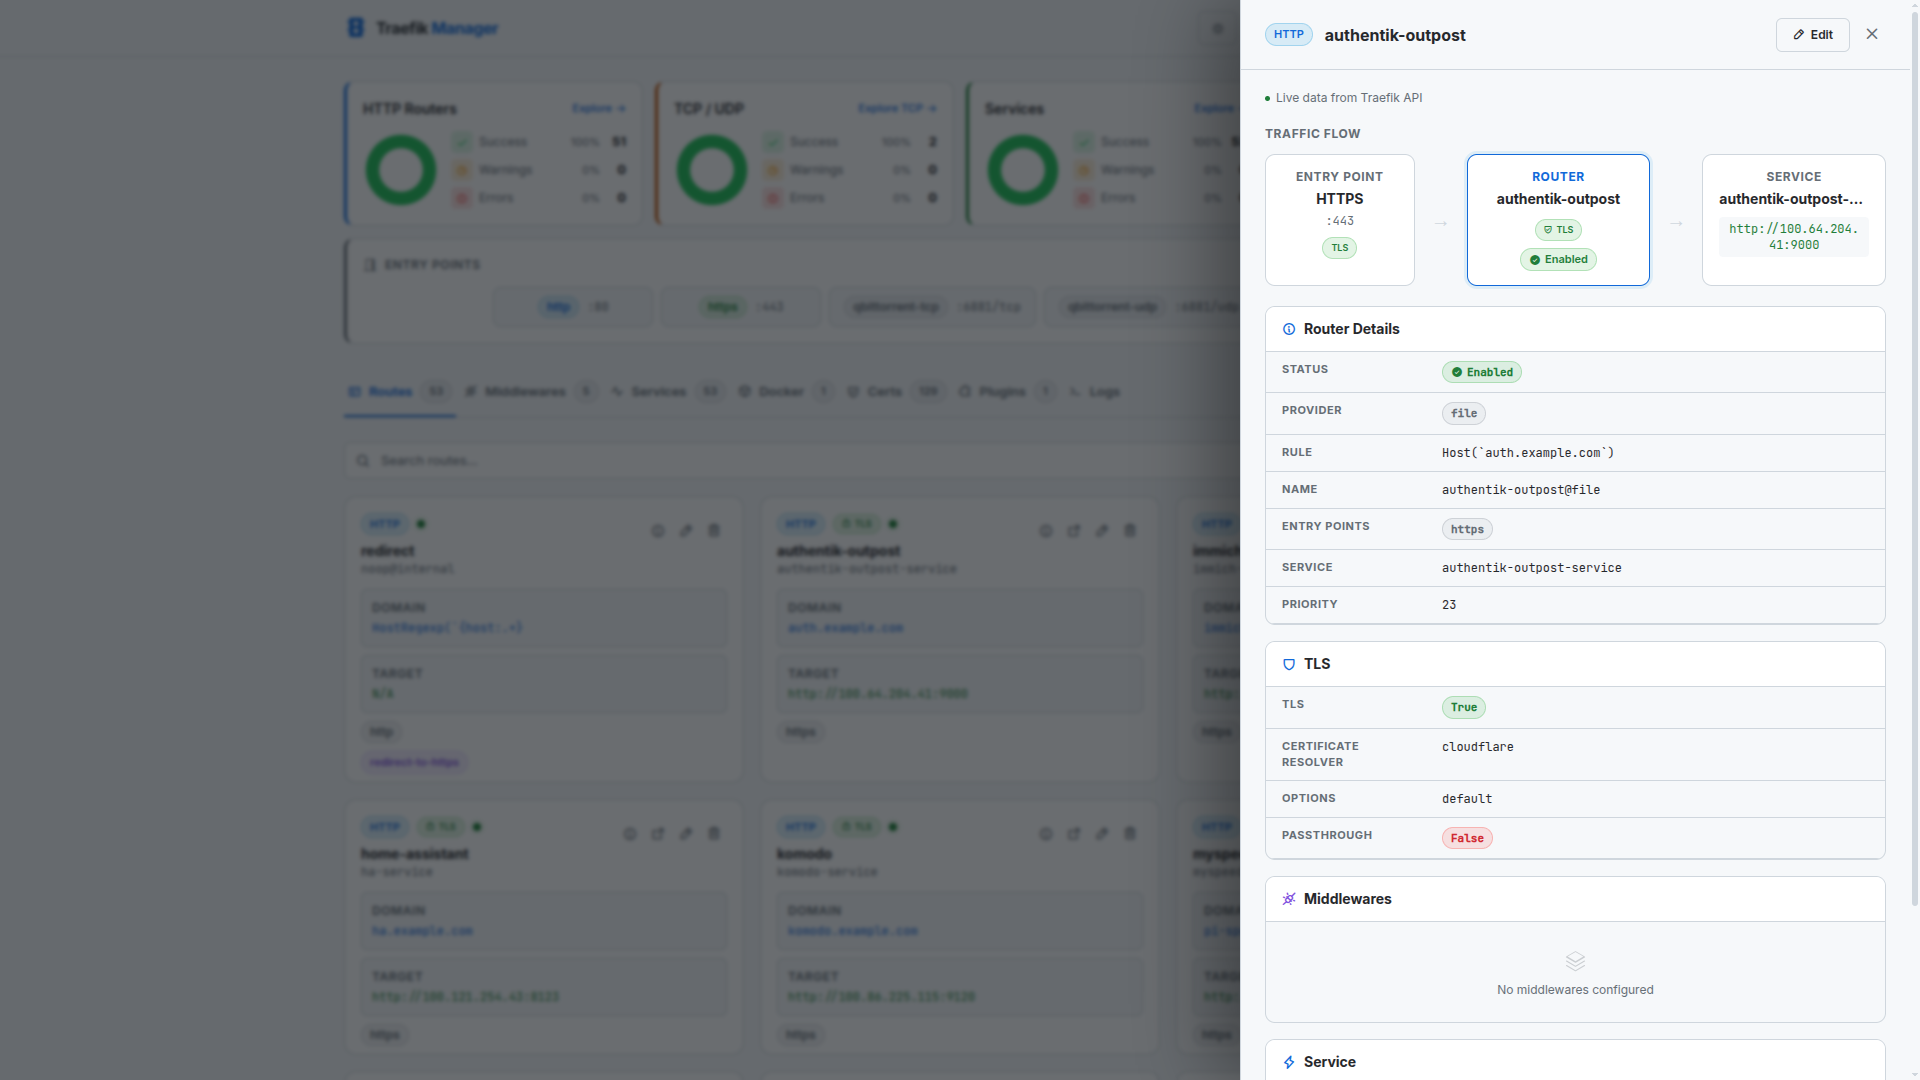
Routes
Routes define how incoming traffic is forwarded to backend services.
Routes Overview
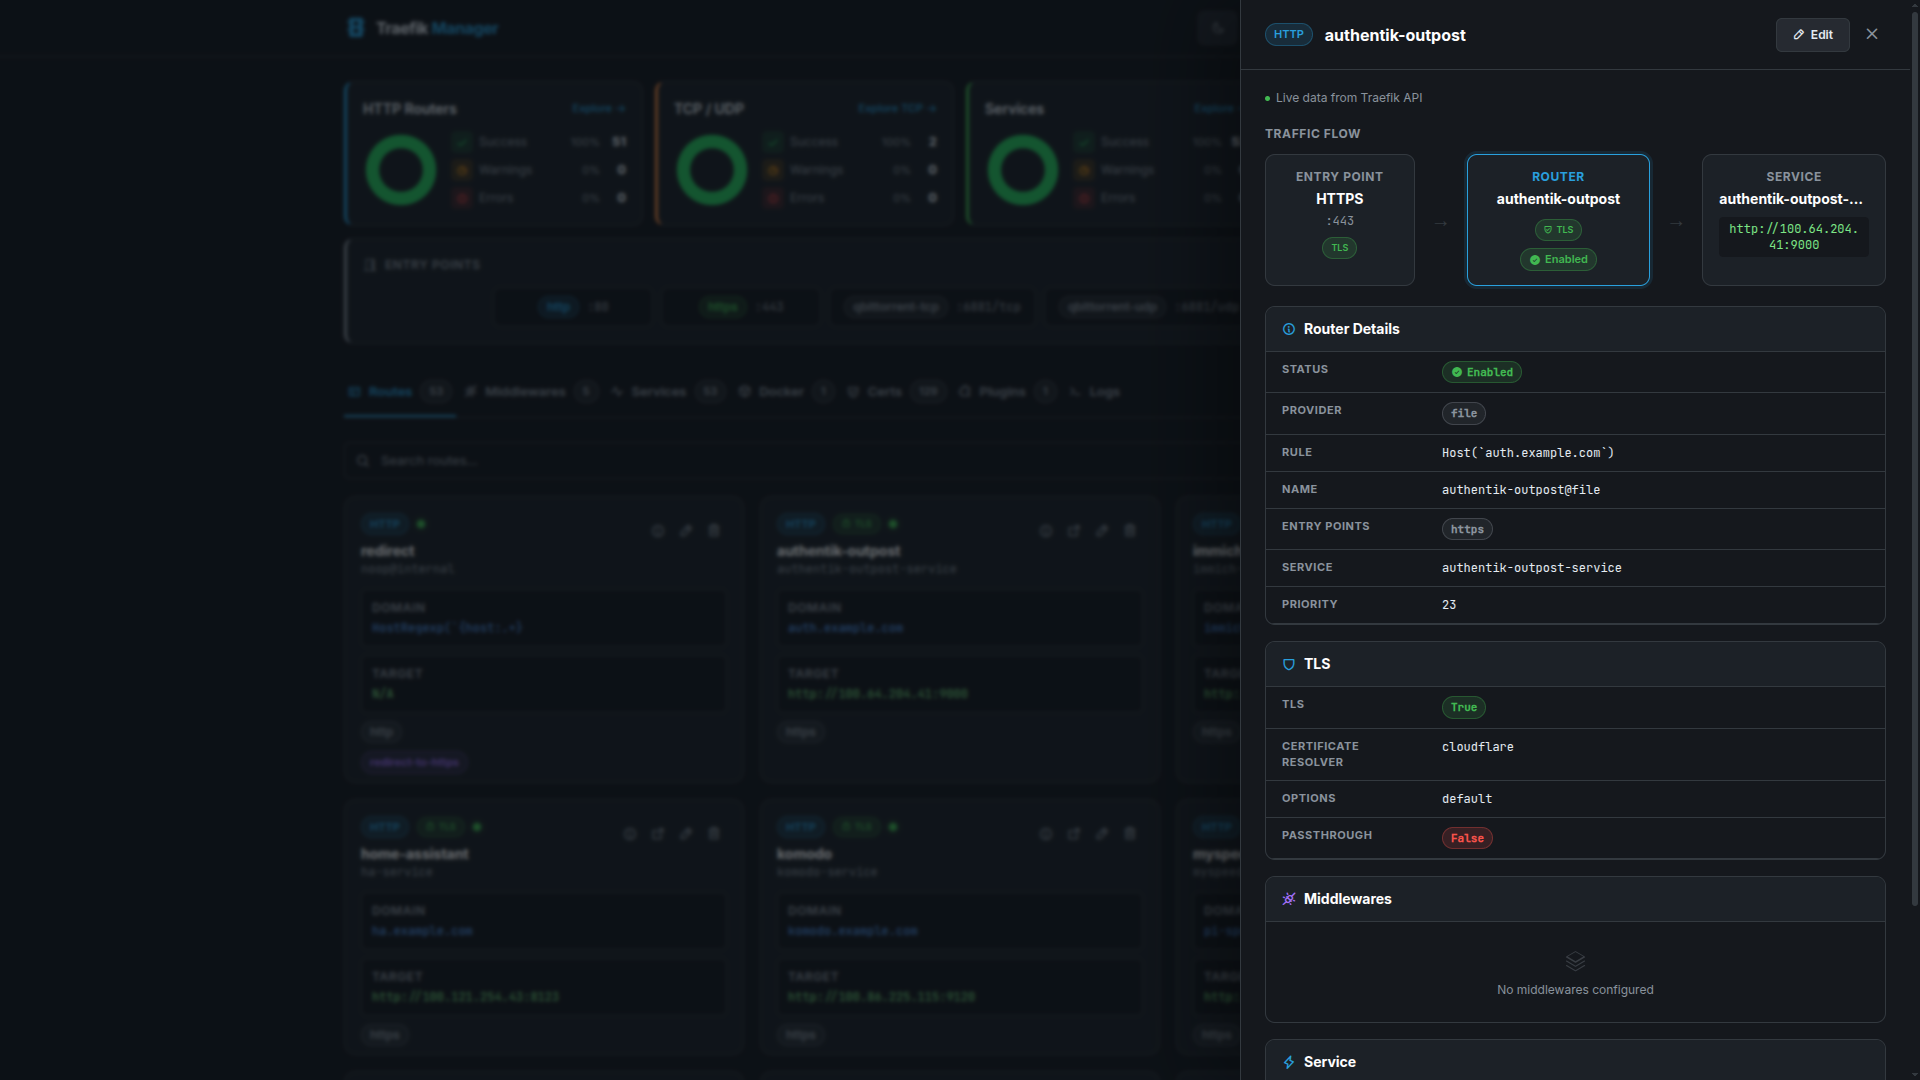
Route Details
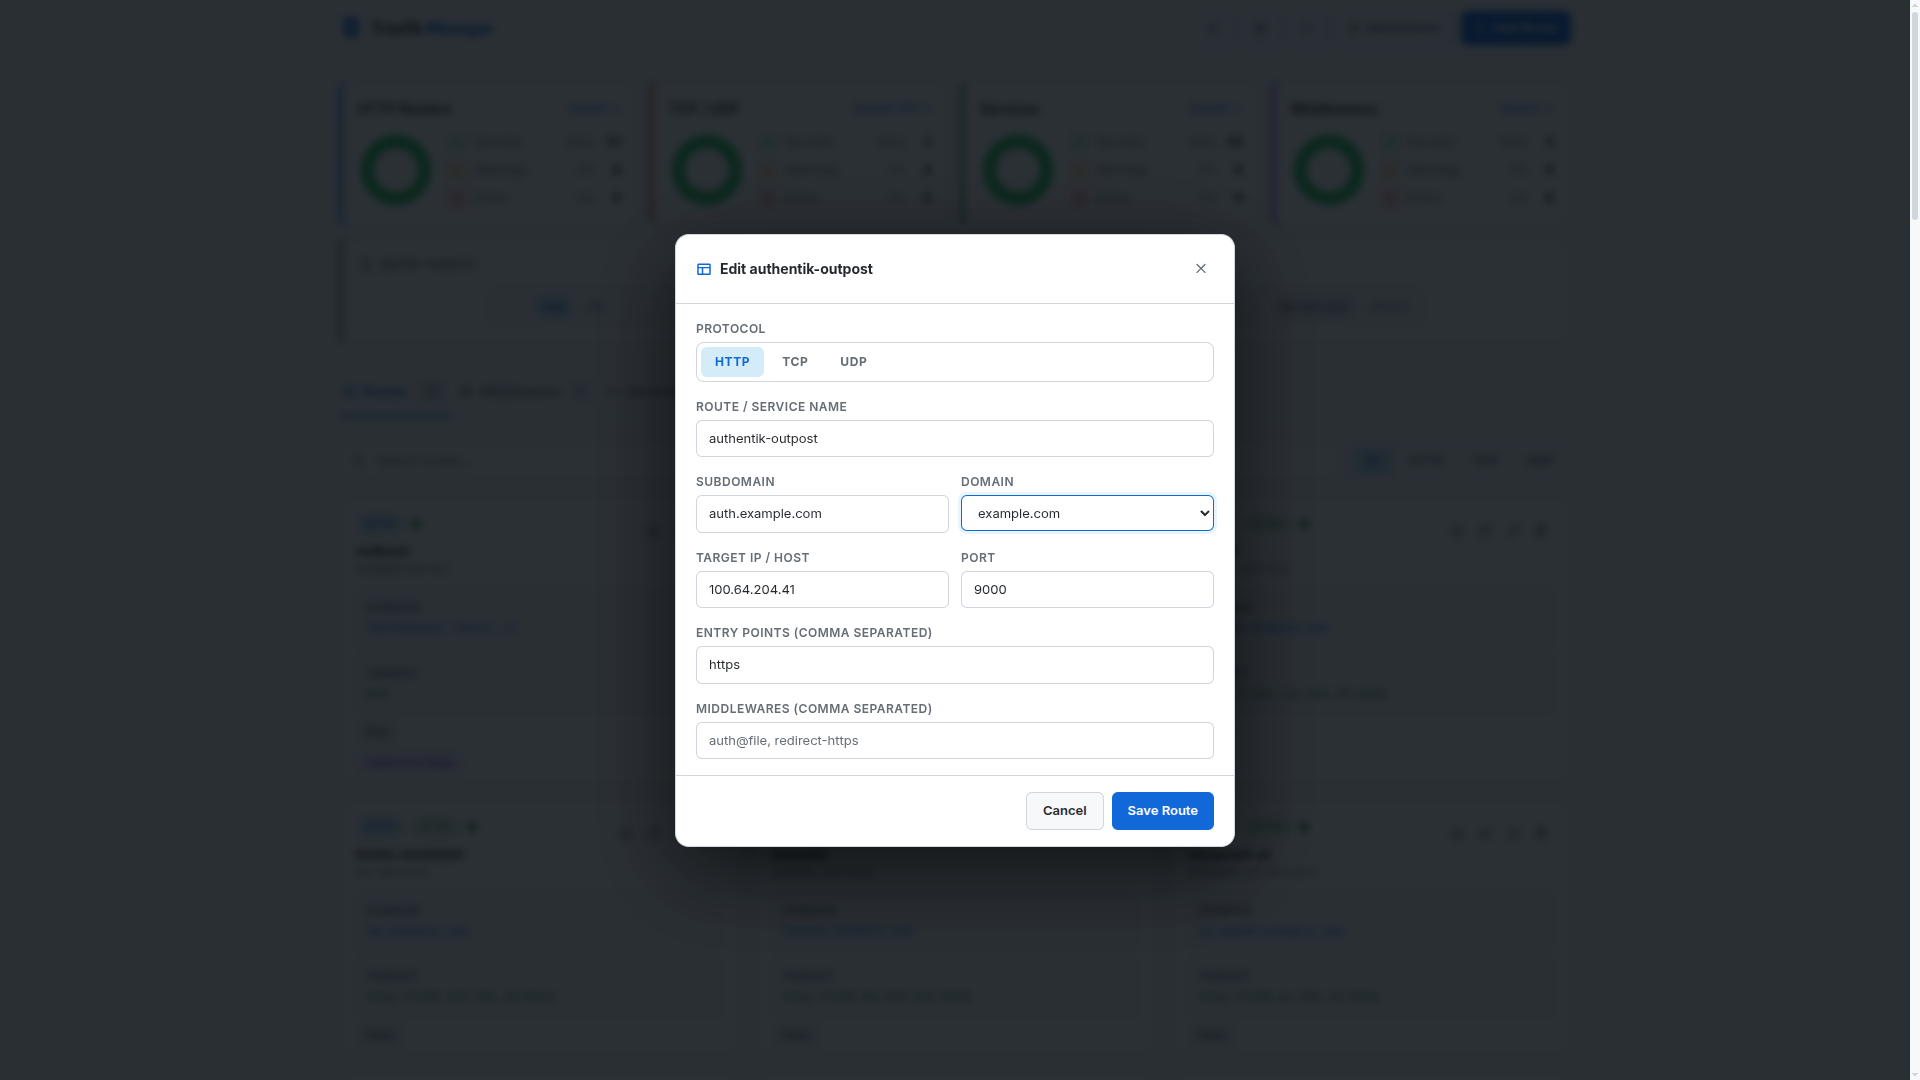
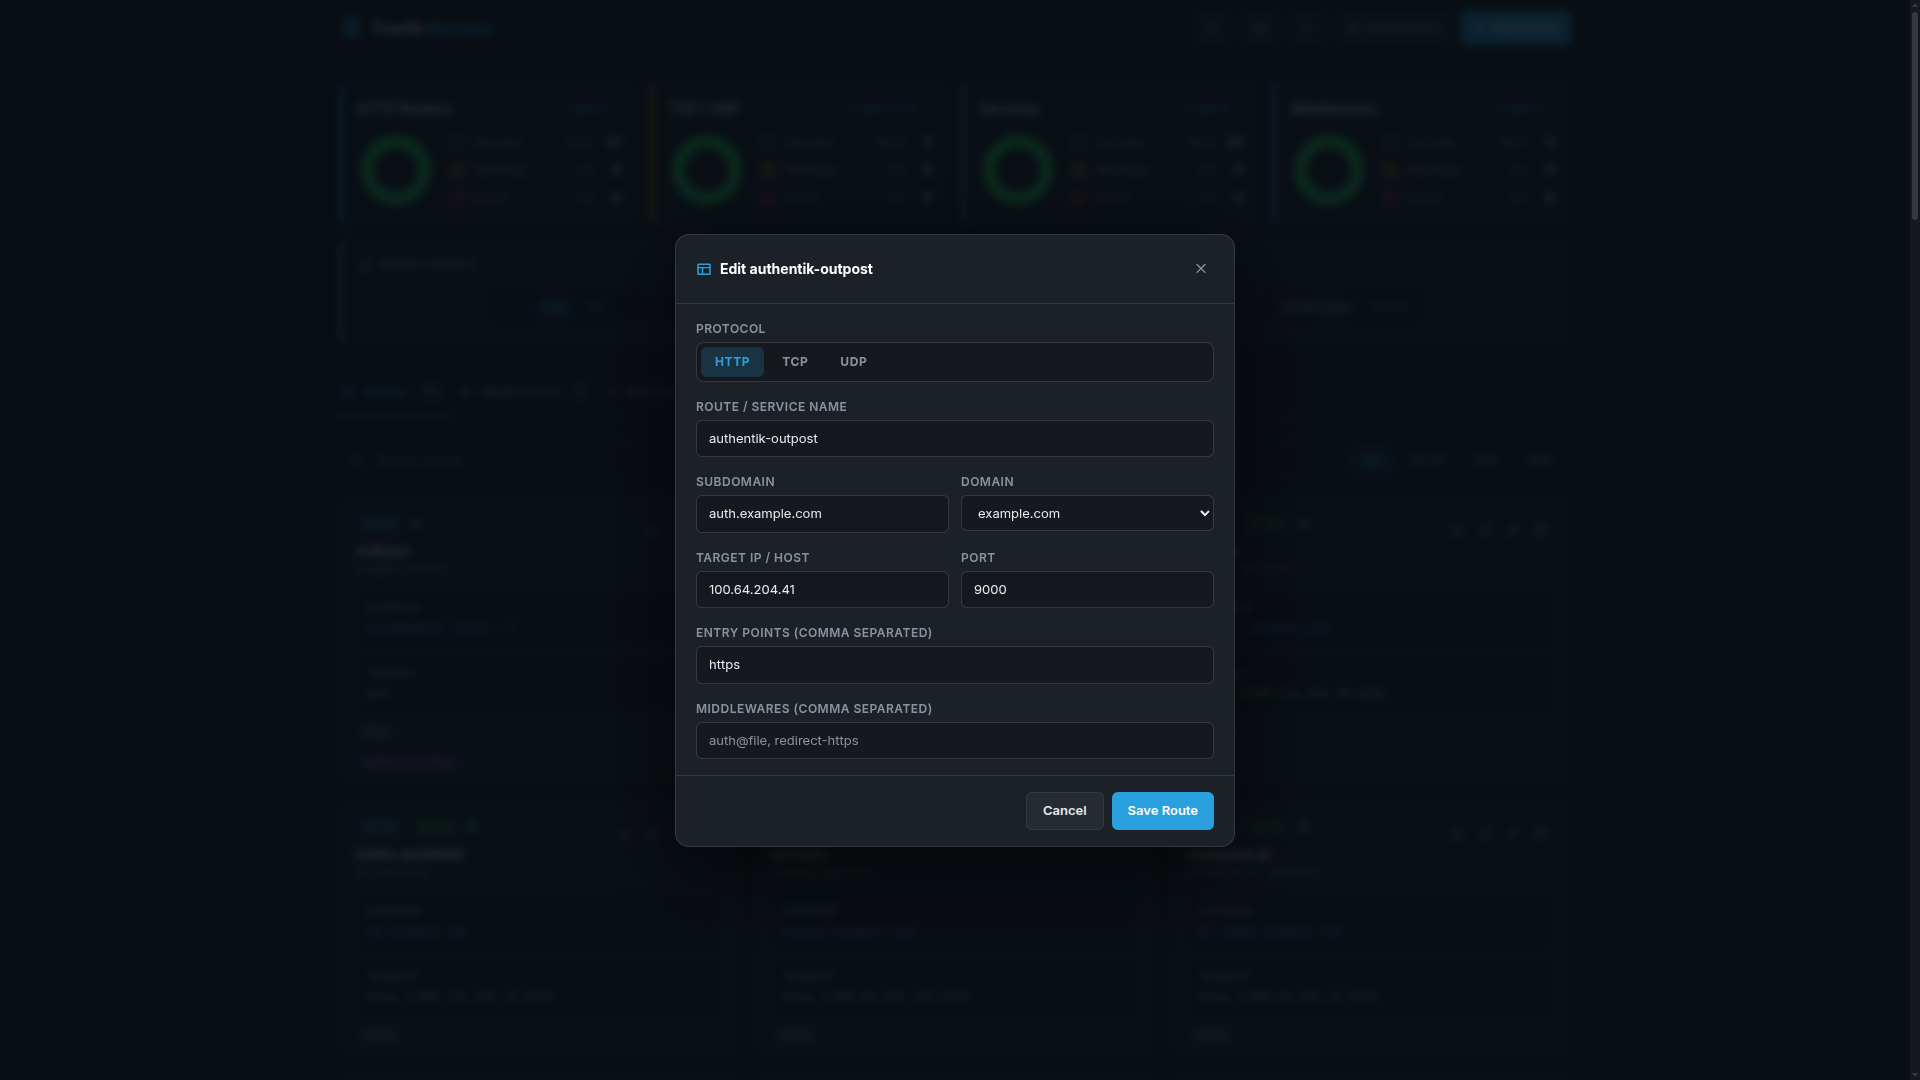
Editing a Route
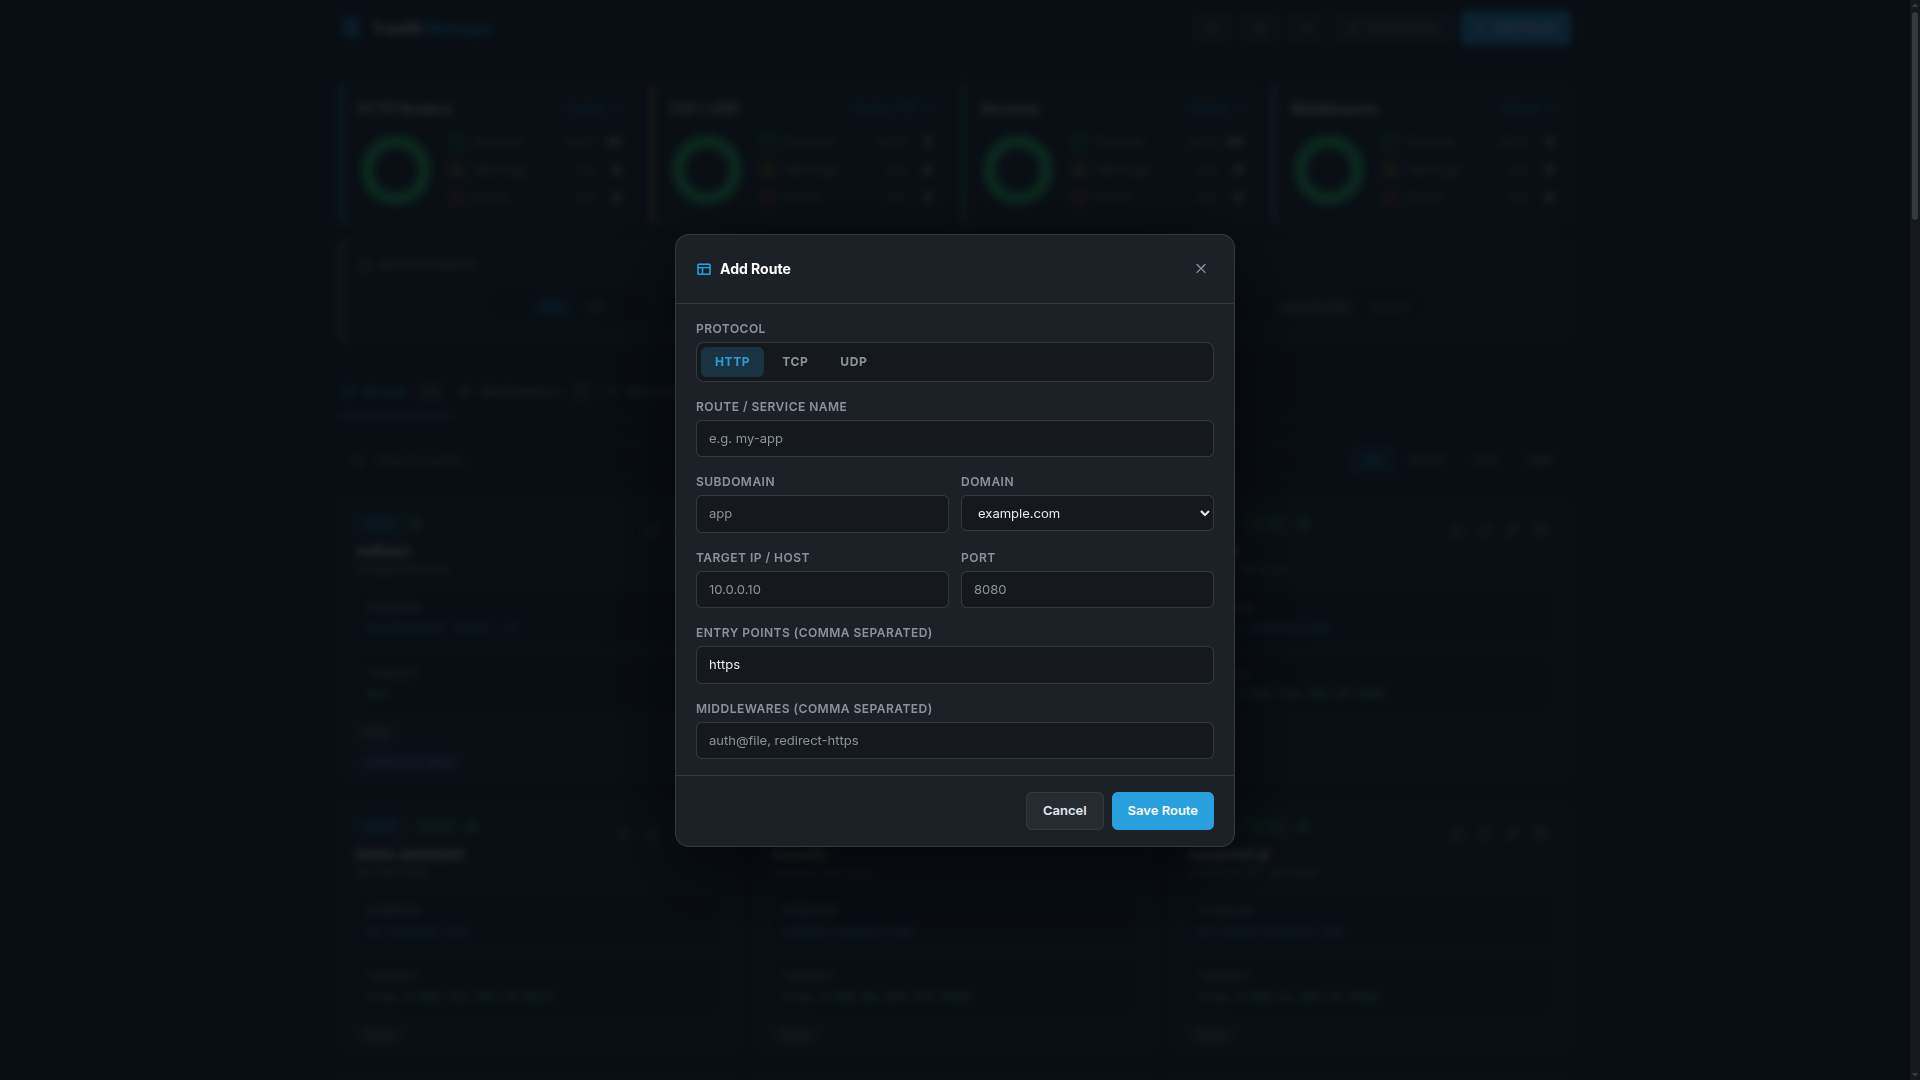
Adding an HTTP Route

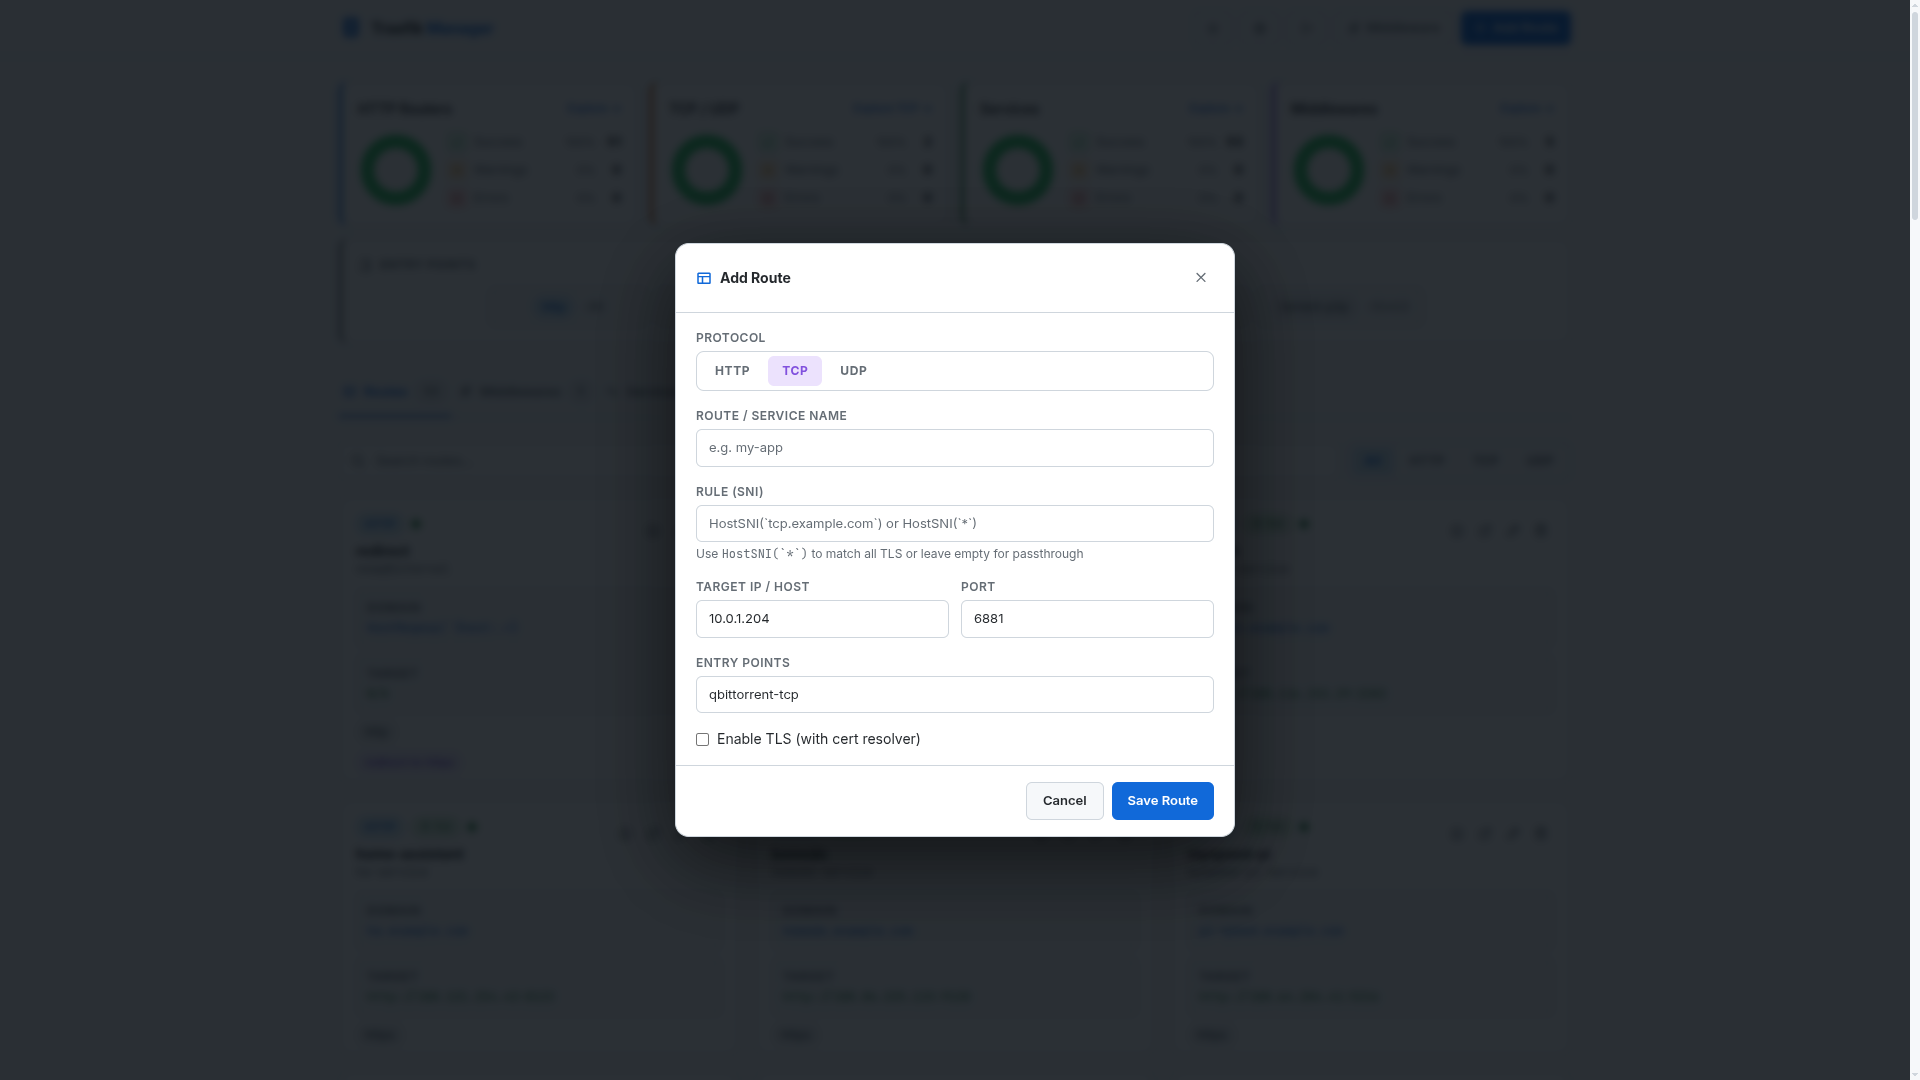
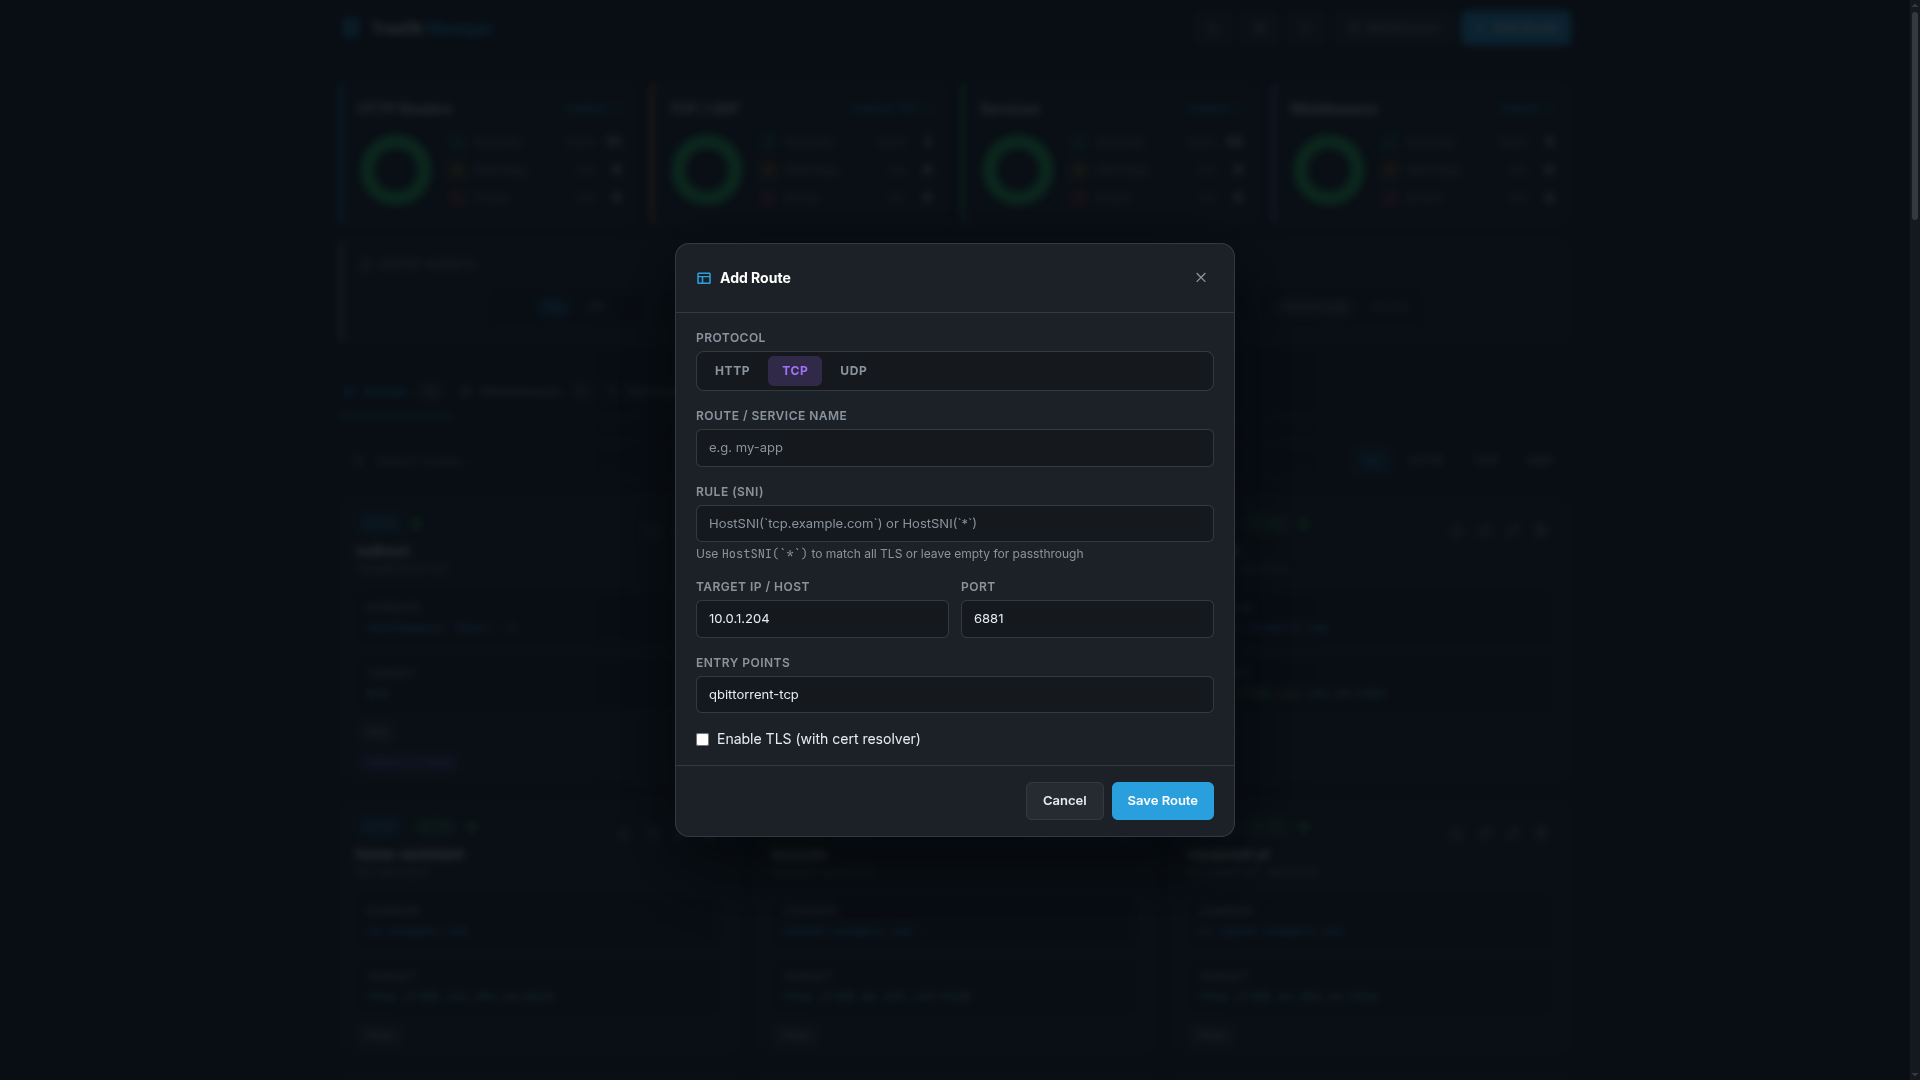
Adding a TCP Route
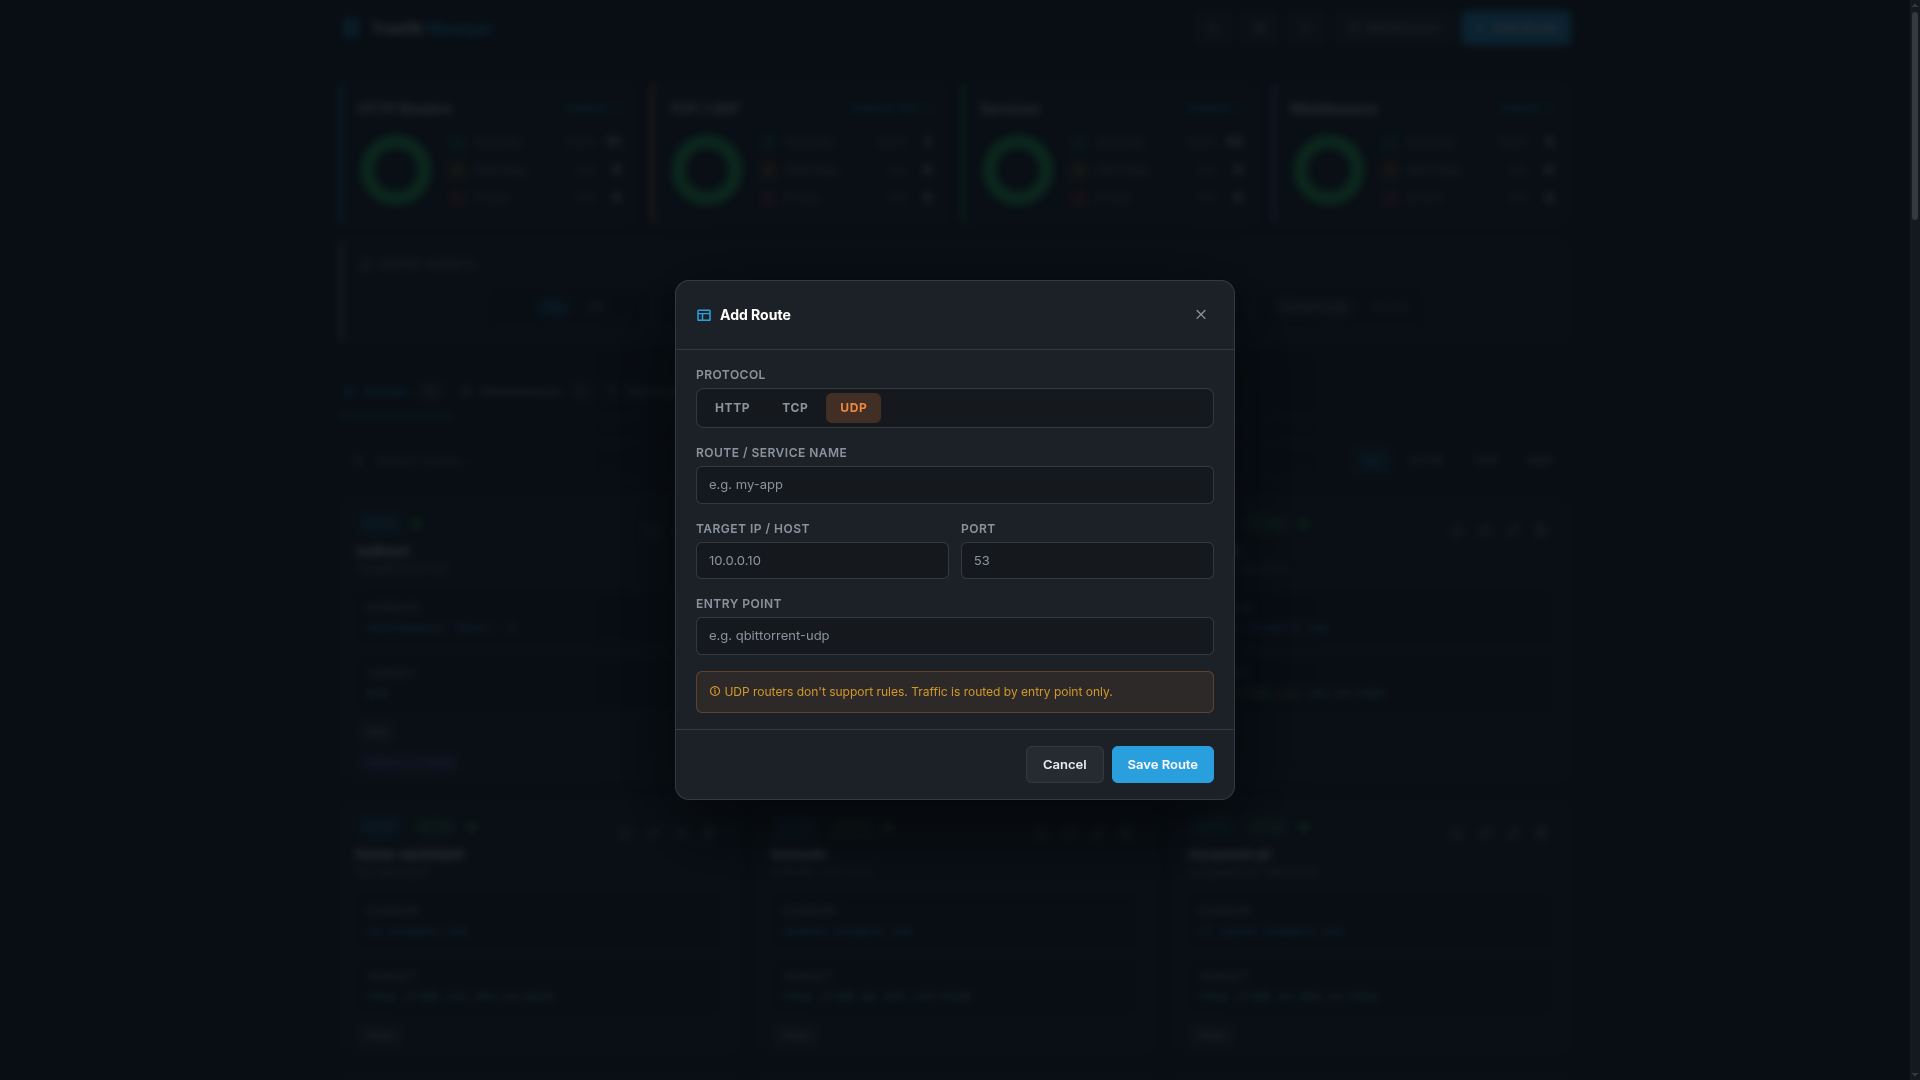
Adding a UDP Route

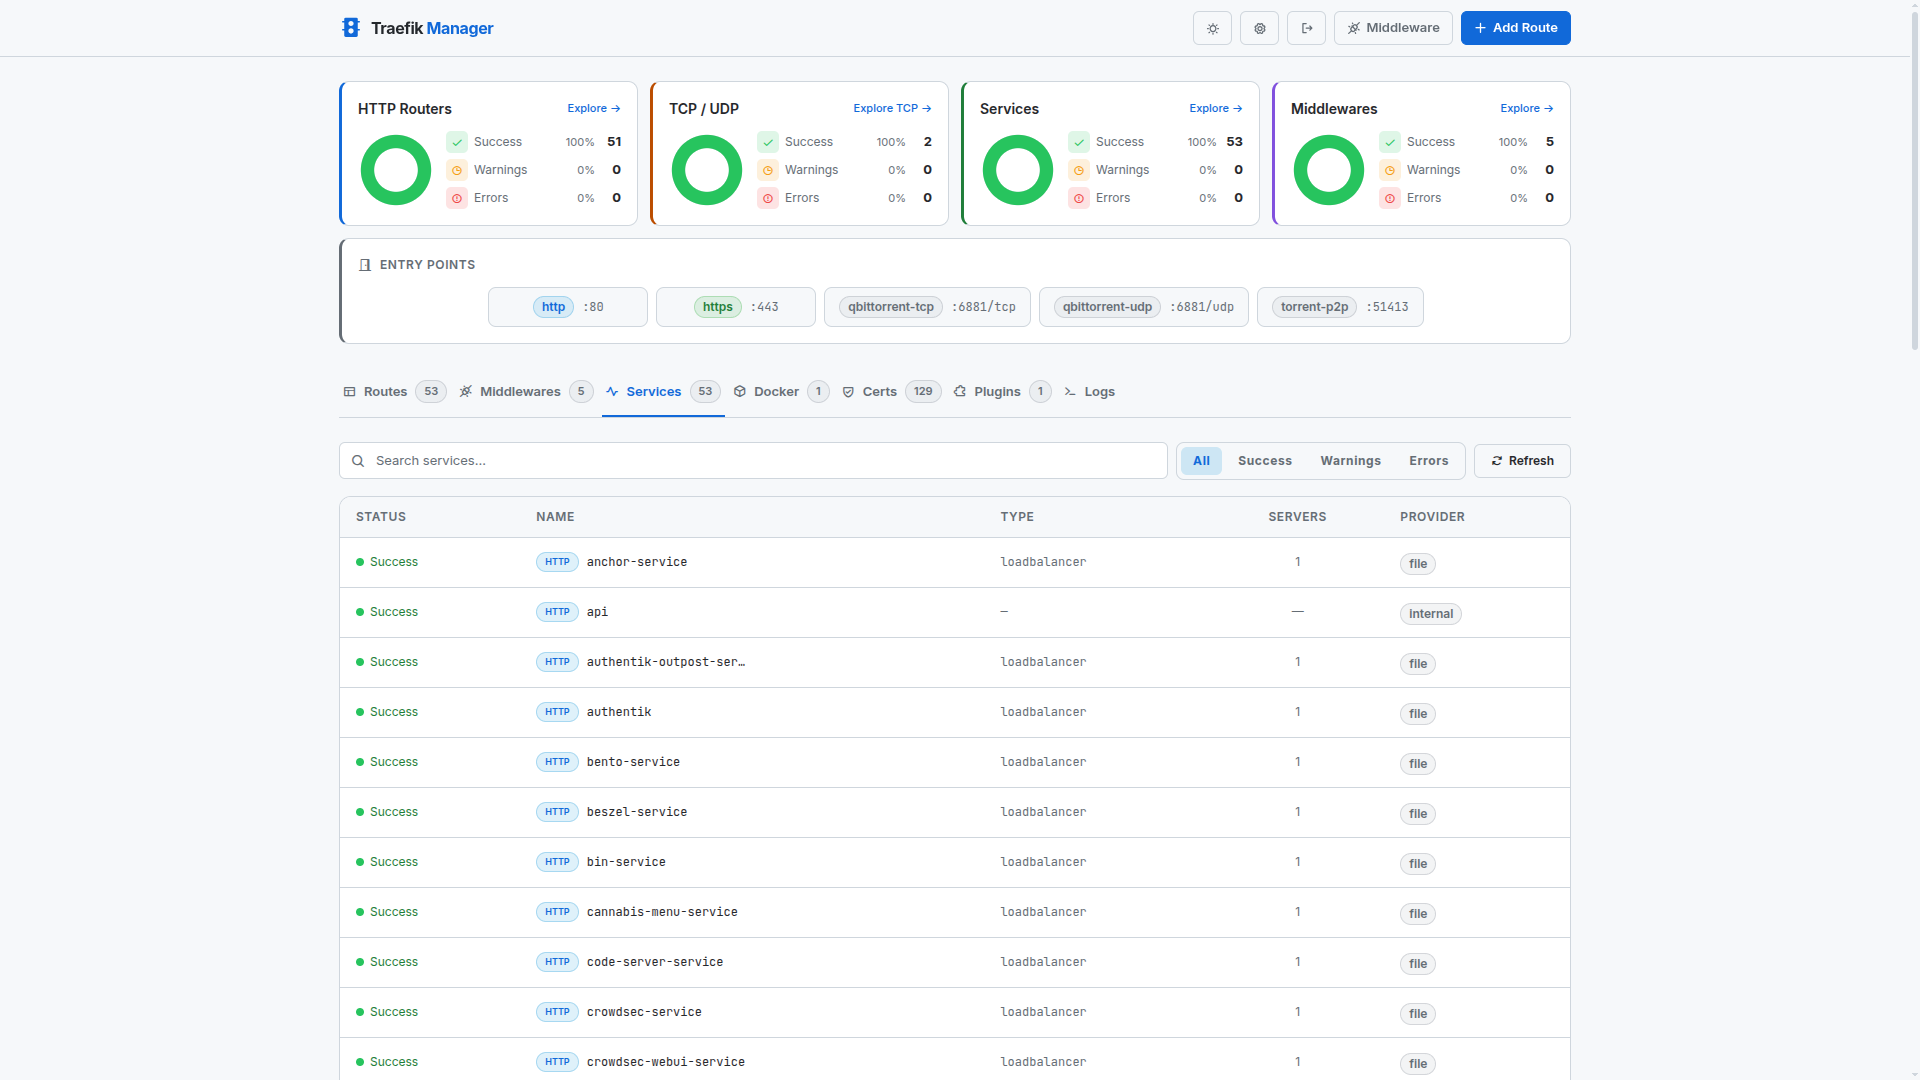
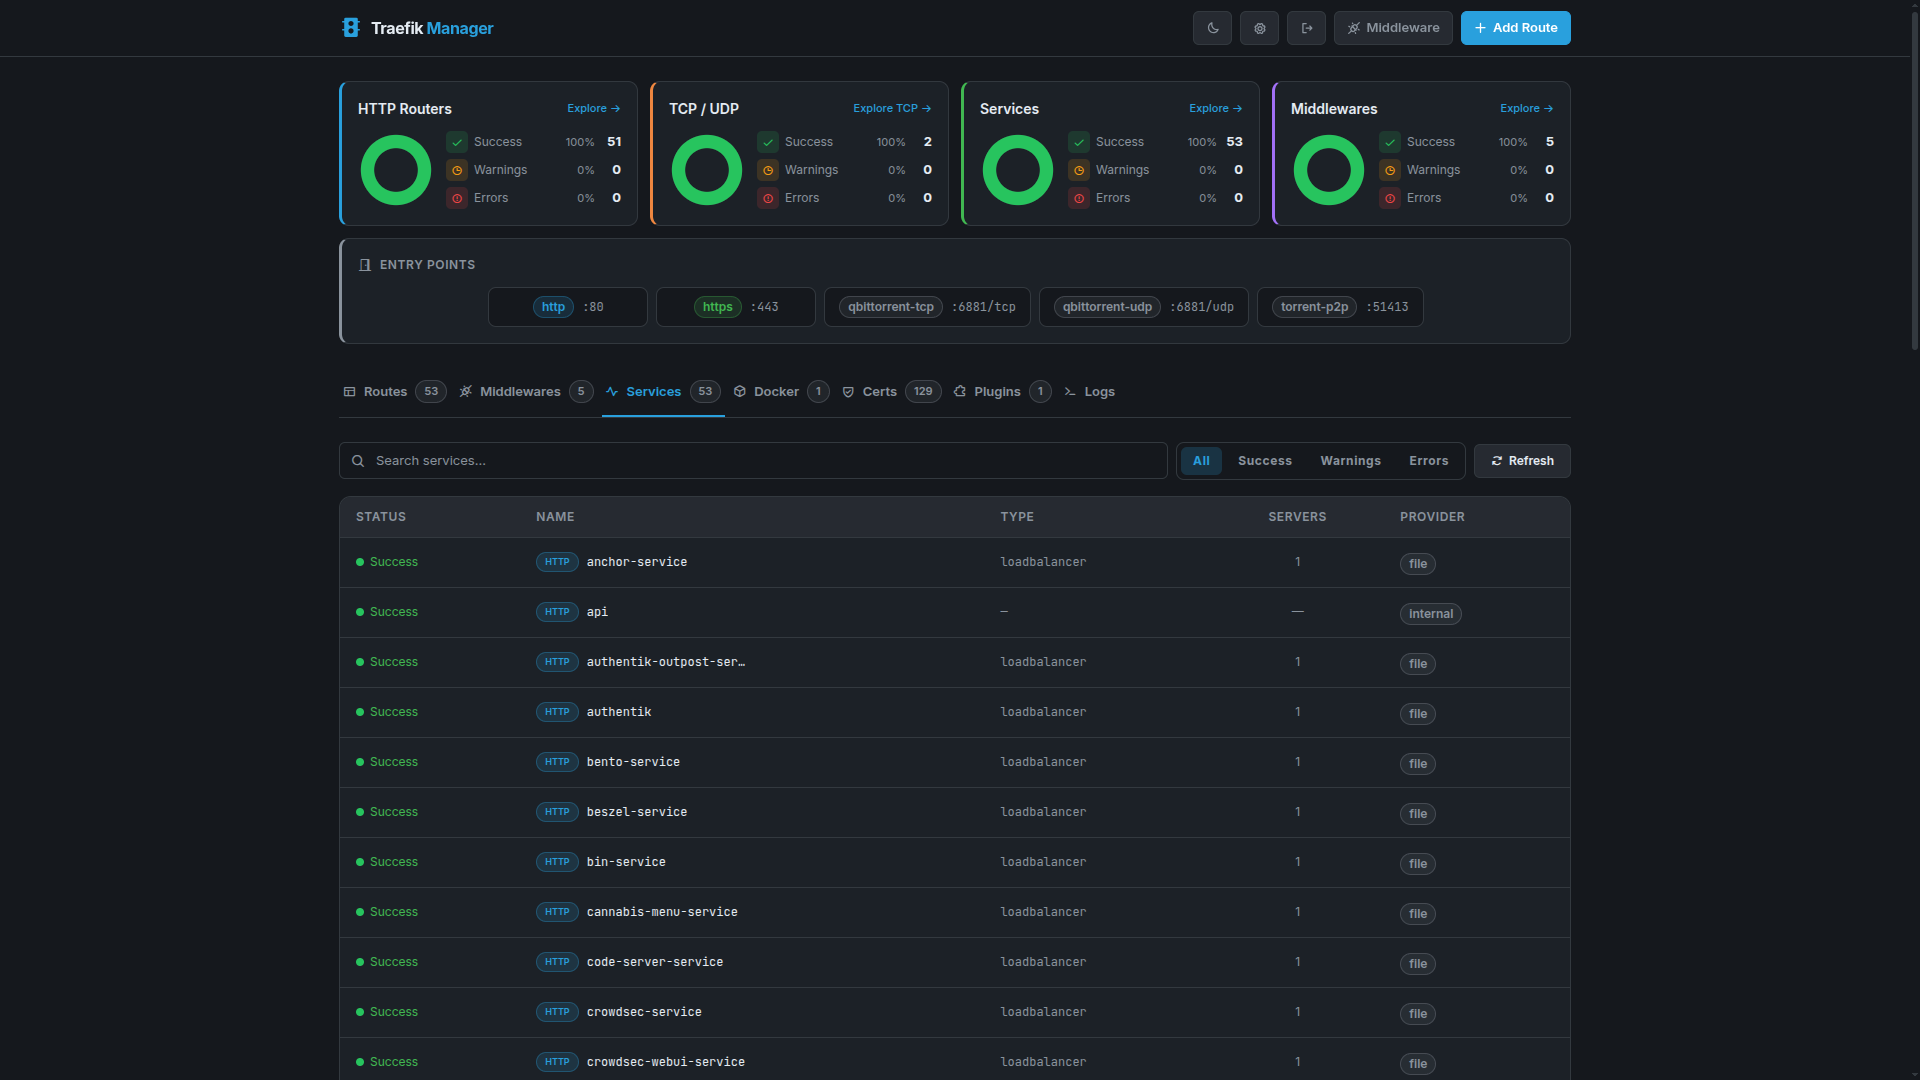
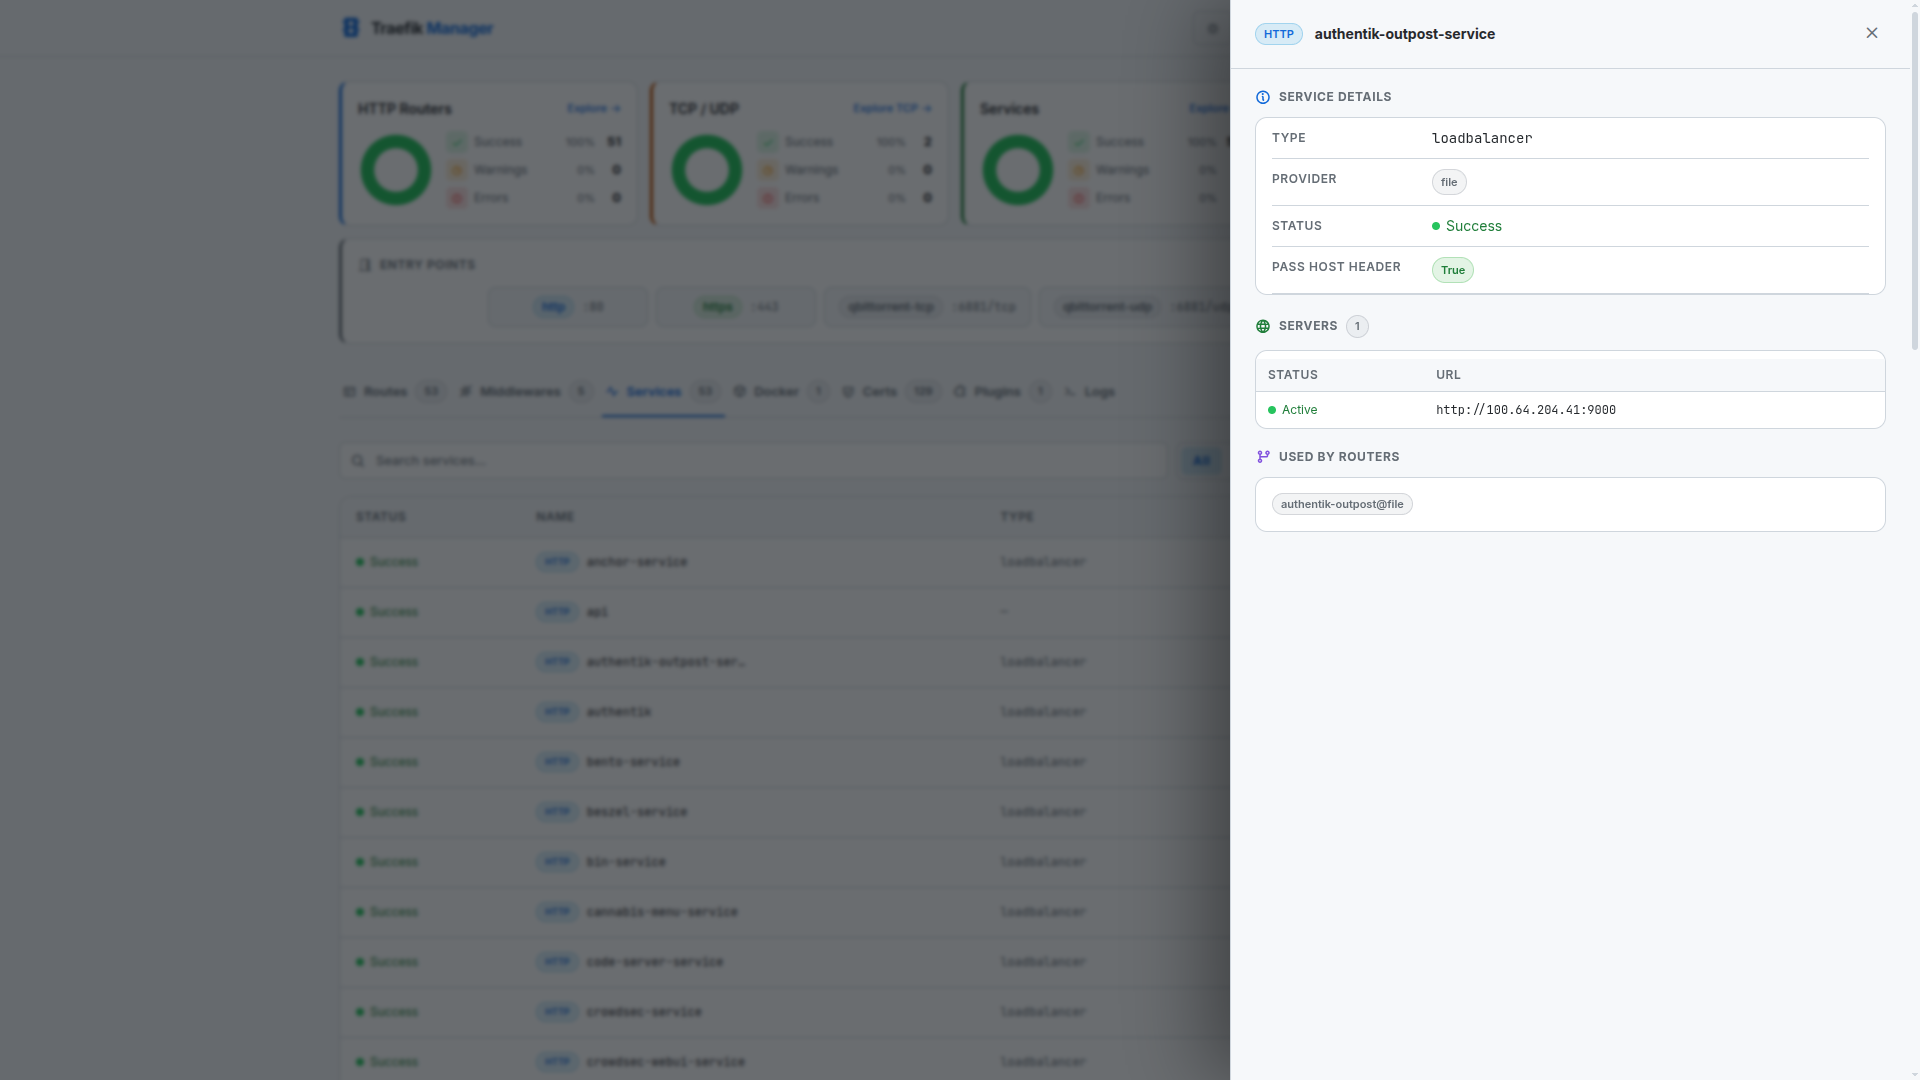
Services
Services represent the backend targets that Traefik forwards traffic to.
Services Overview
Service Details
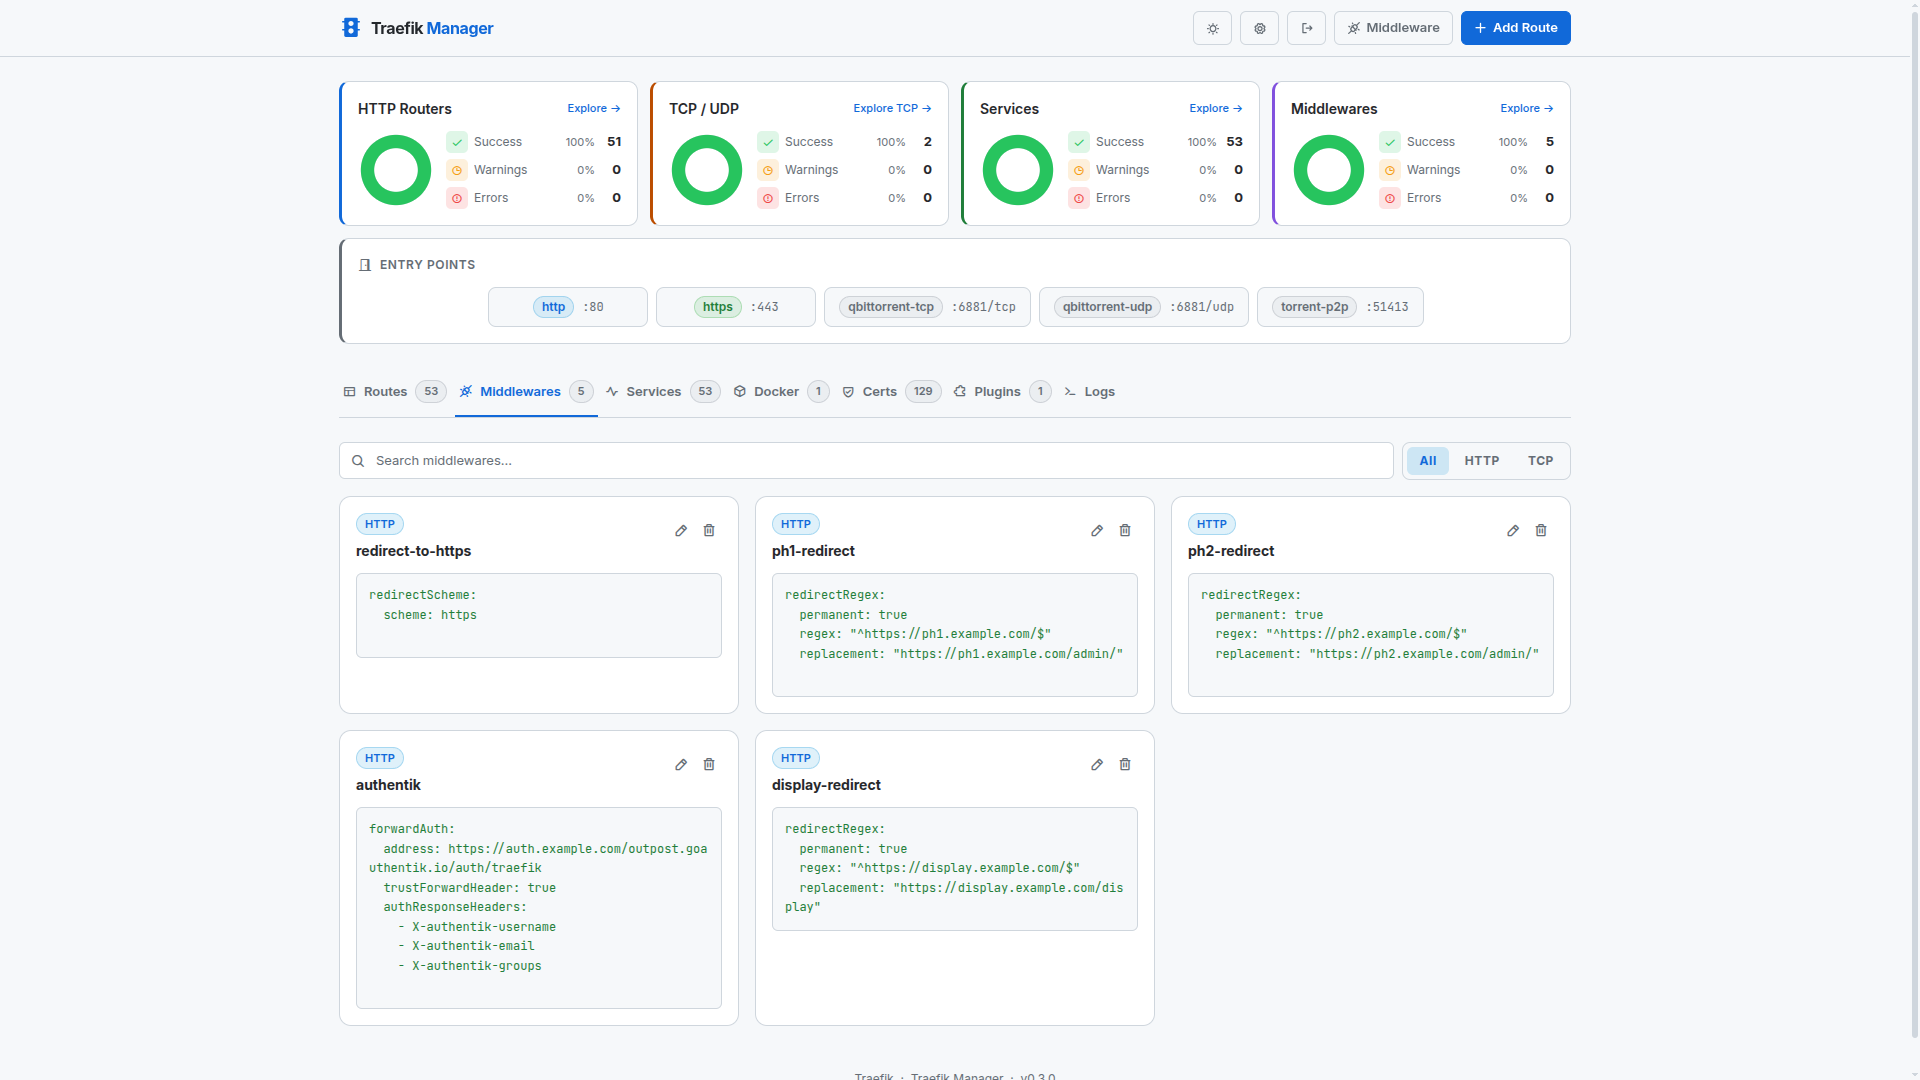
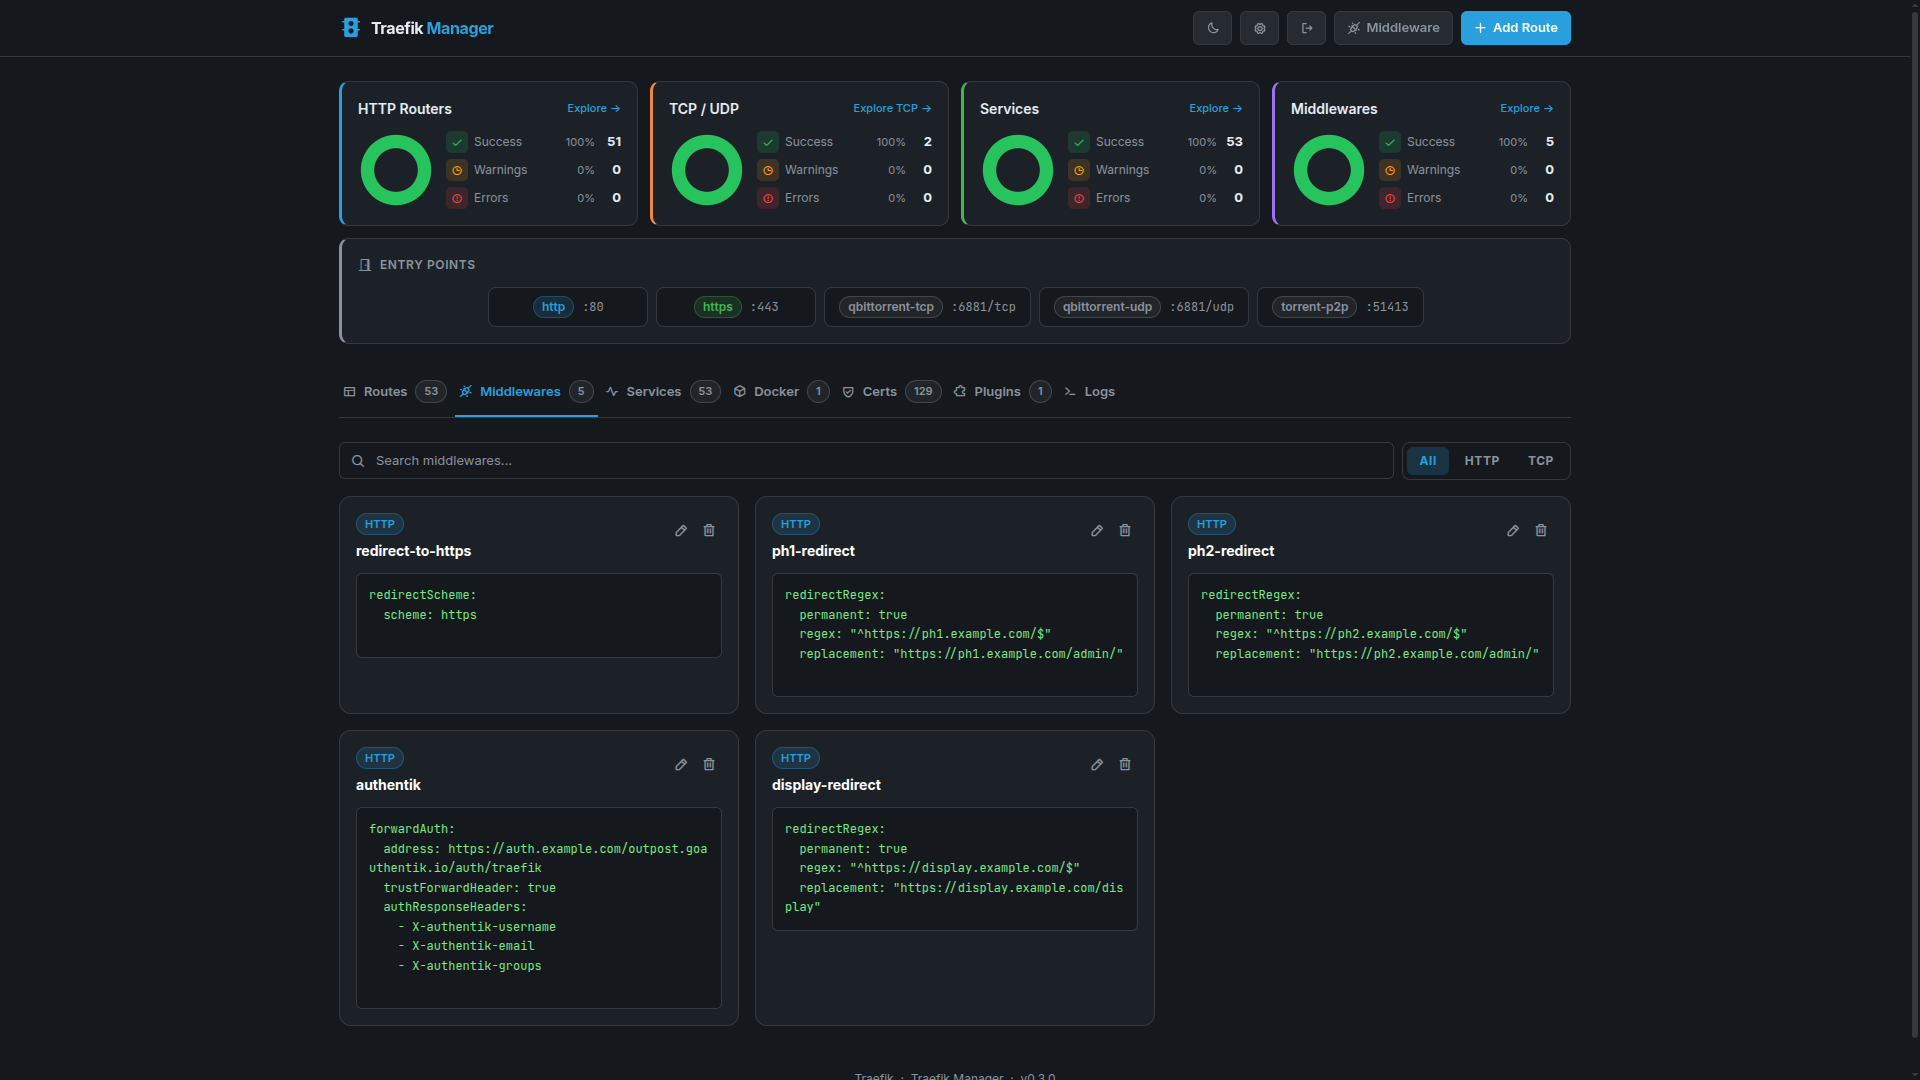
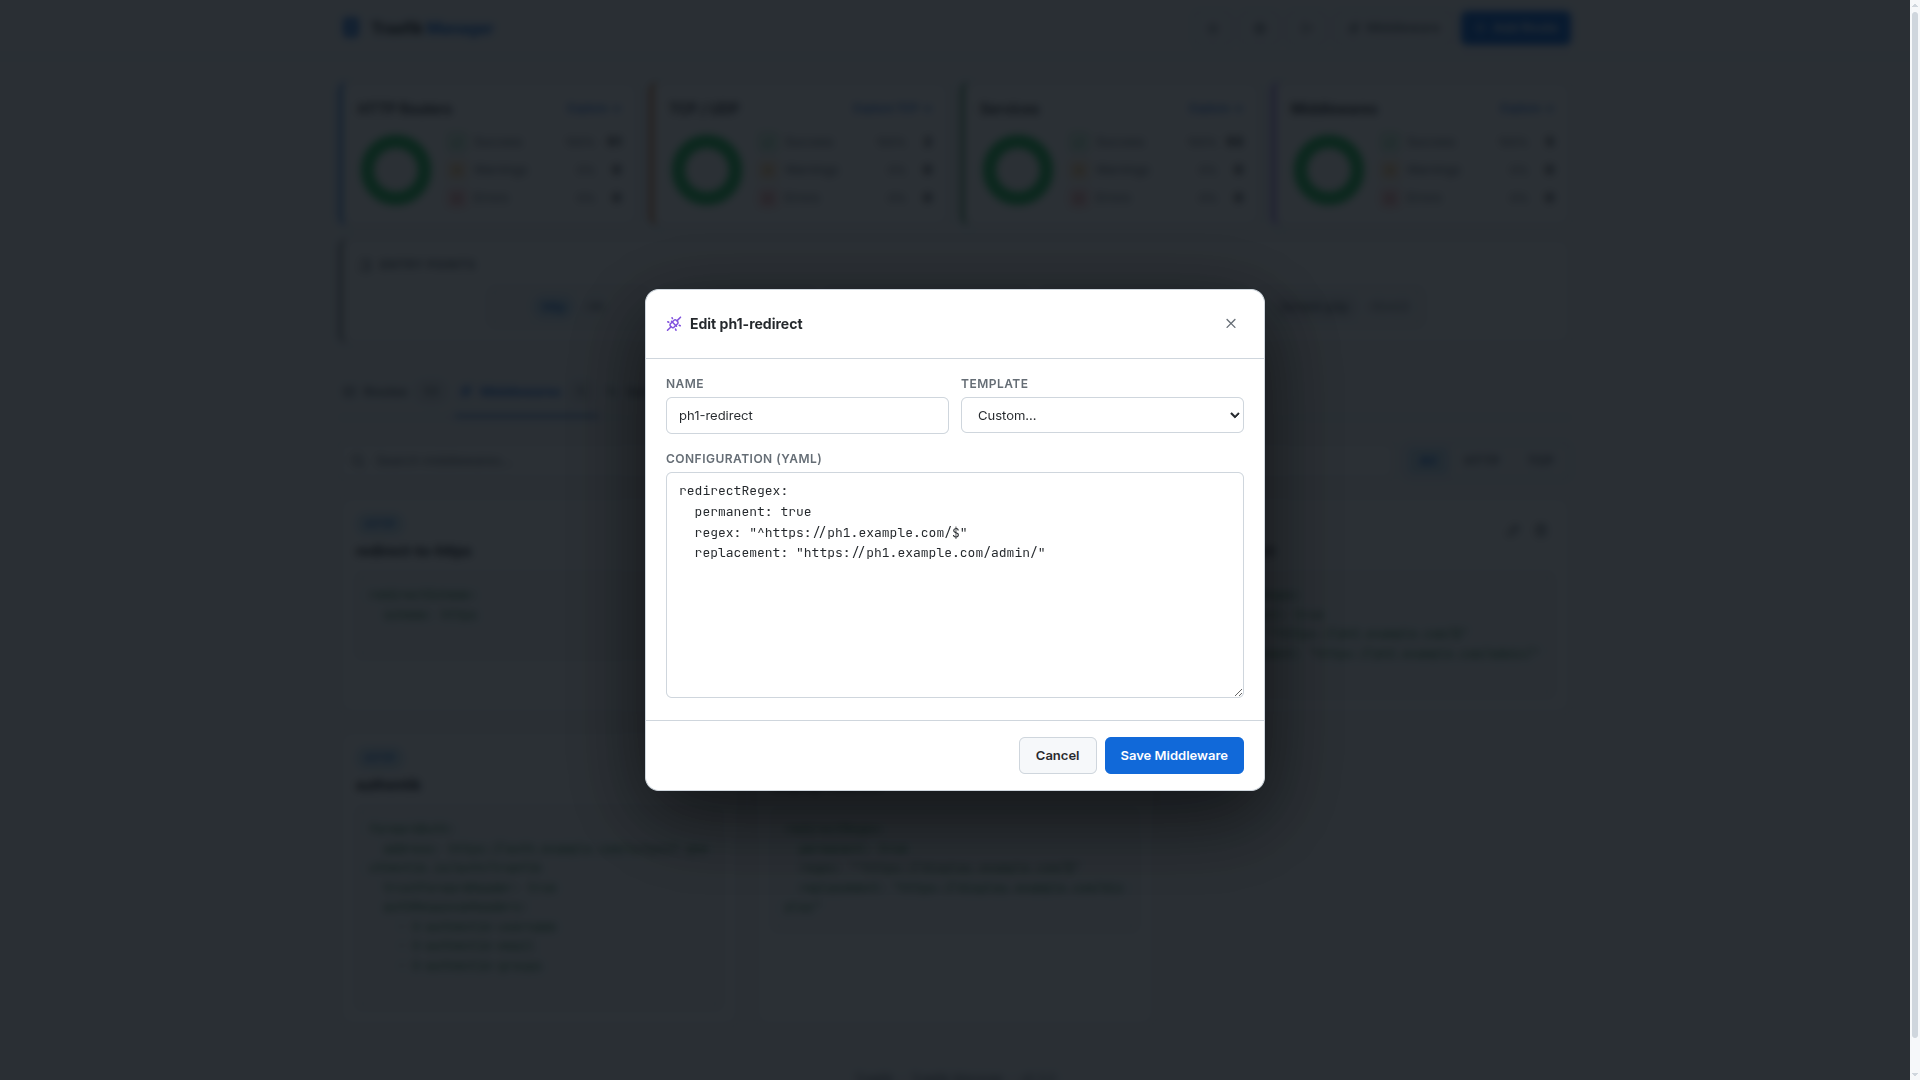
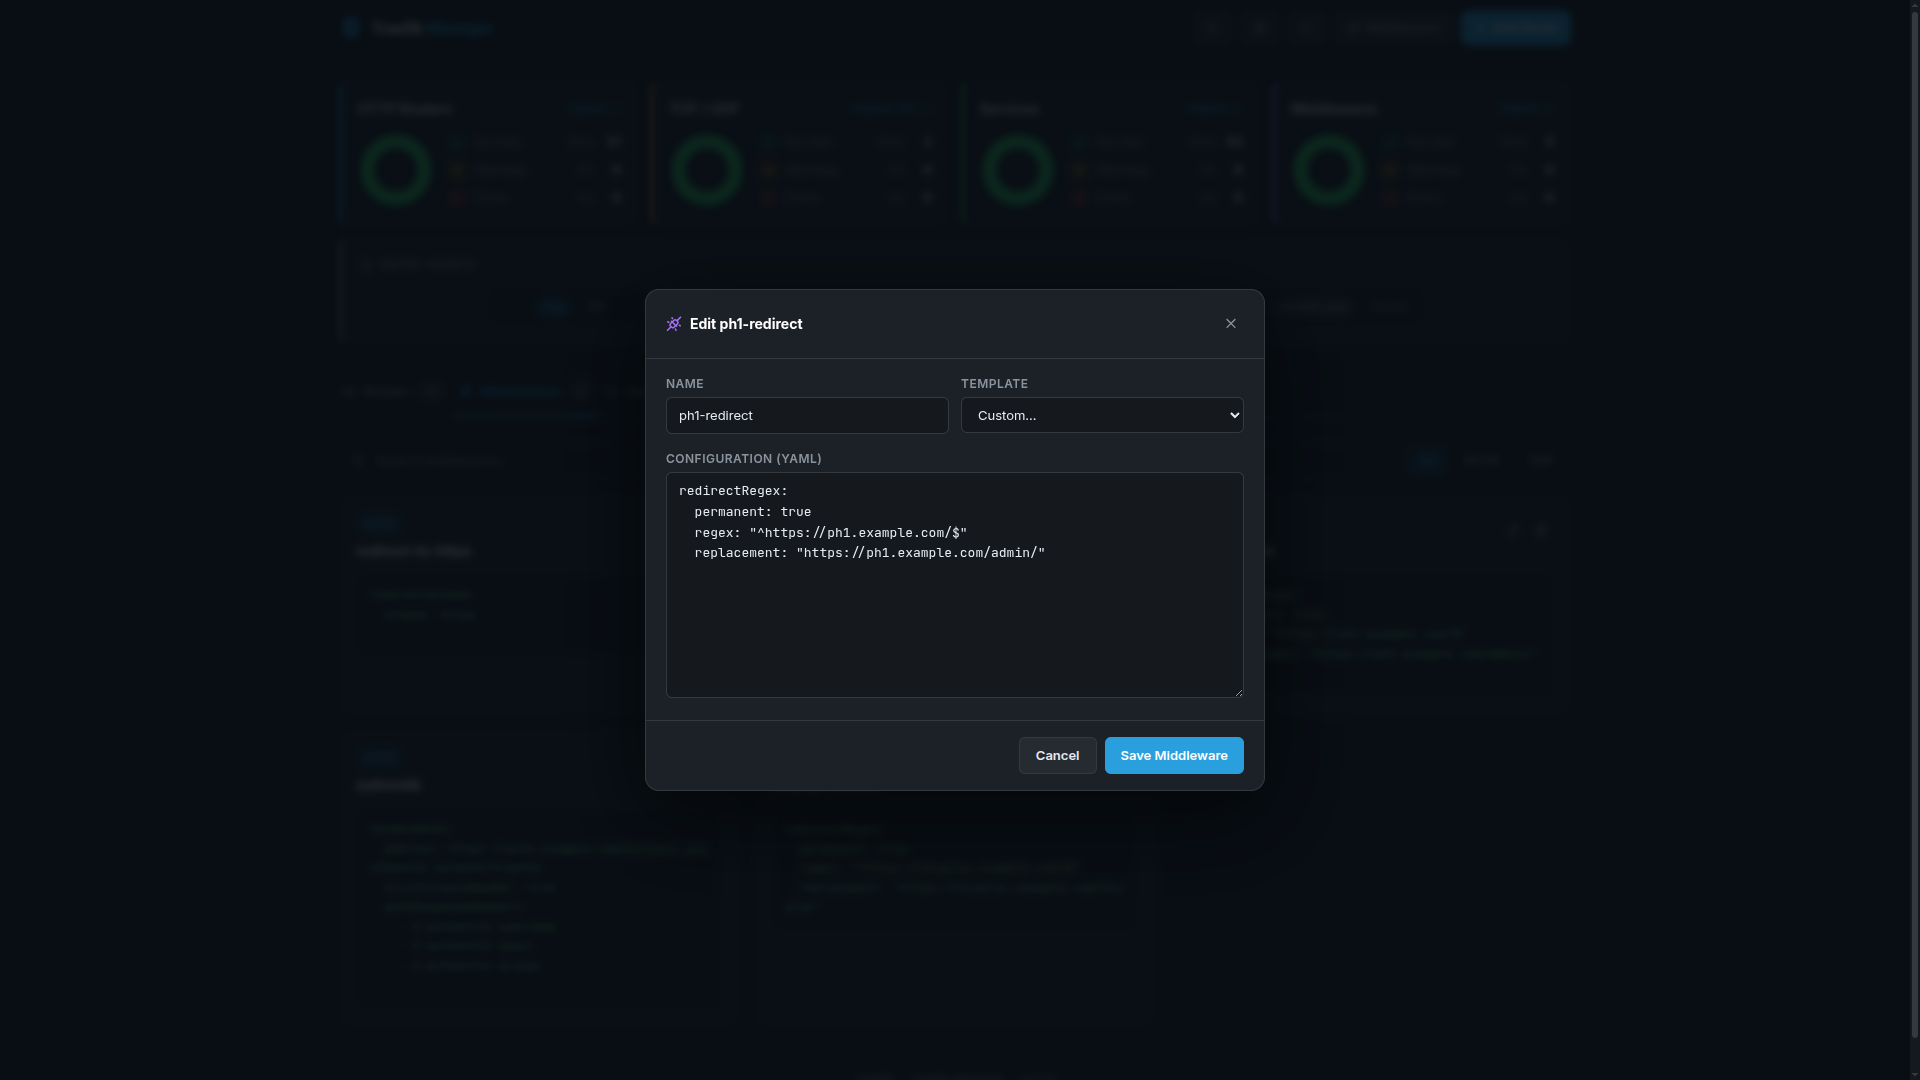
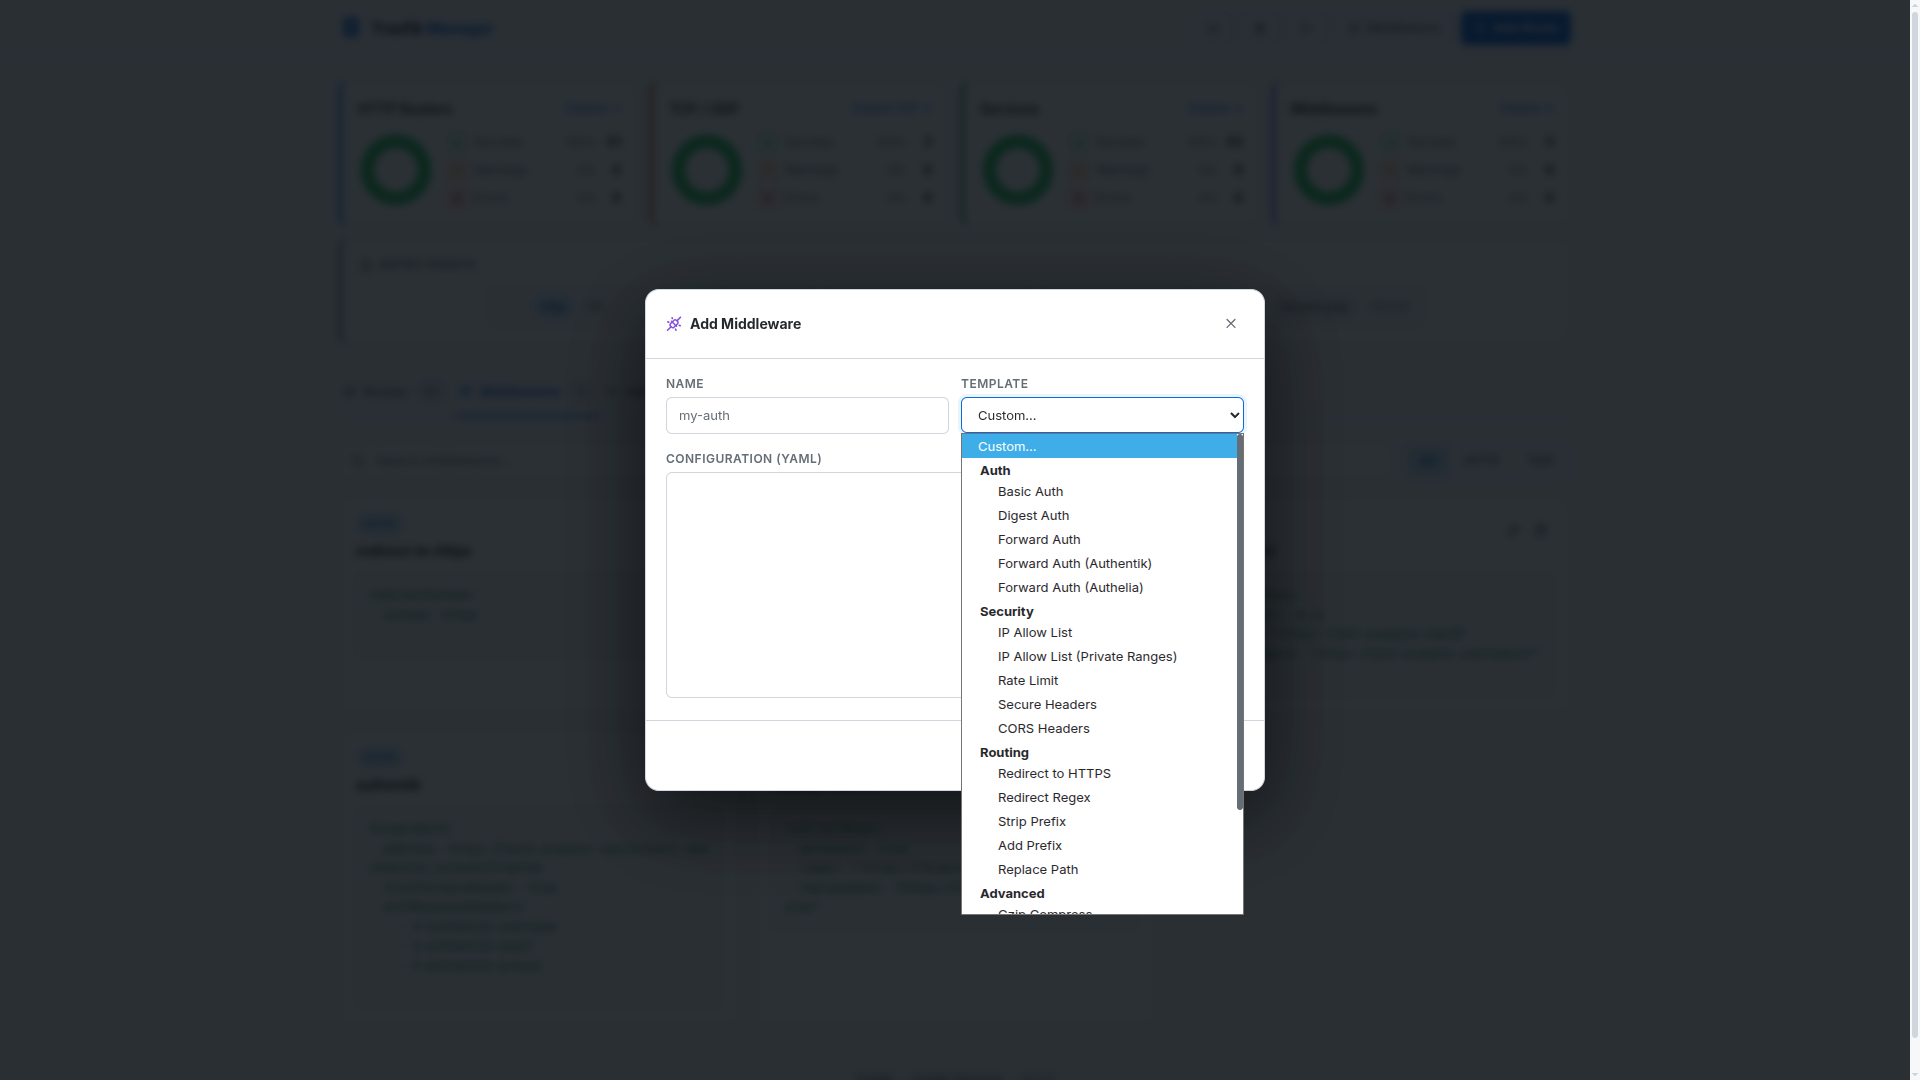
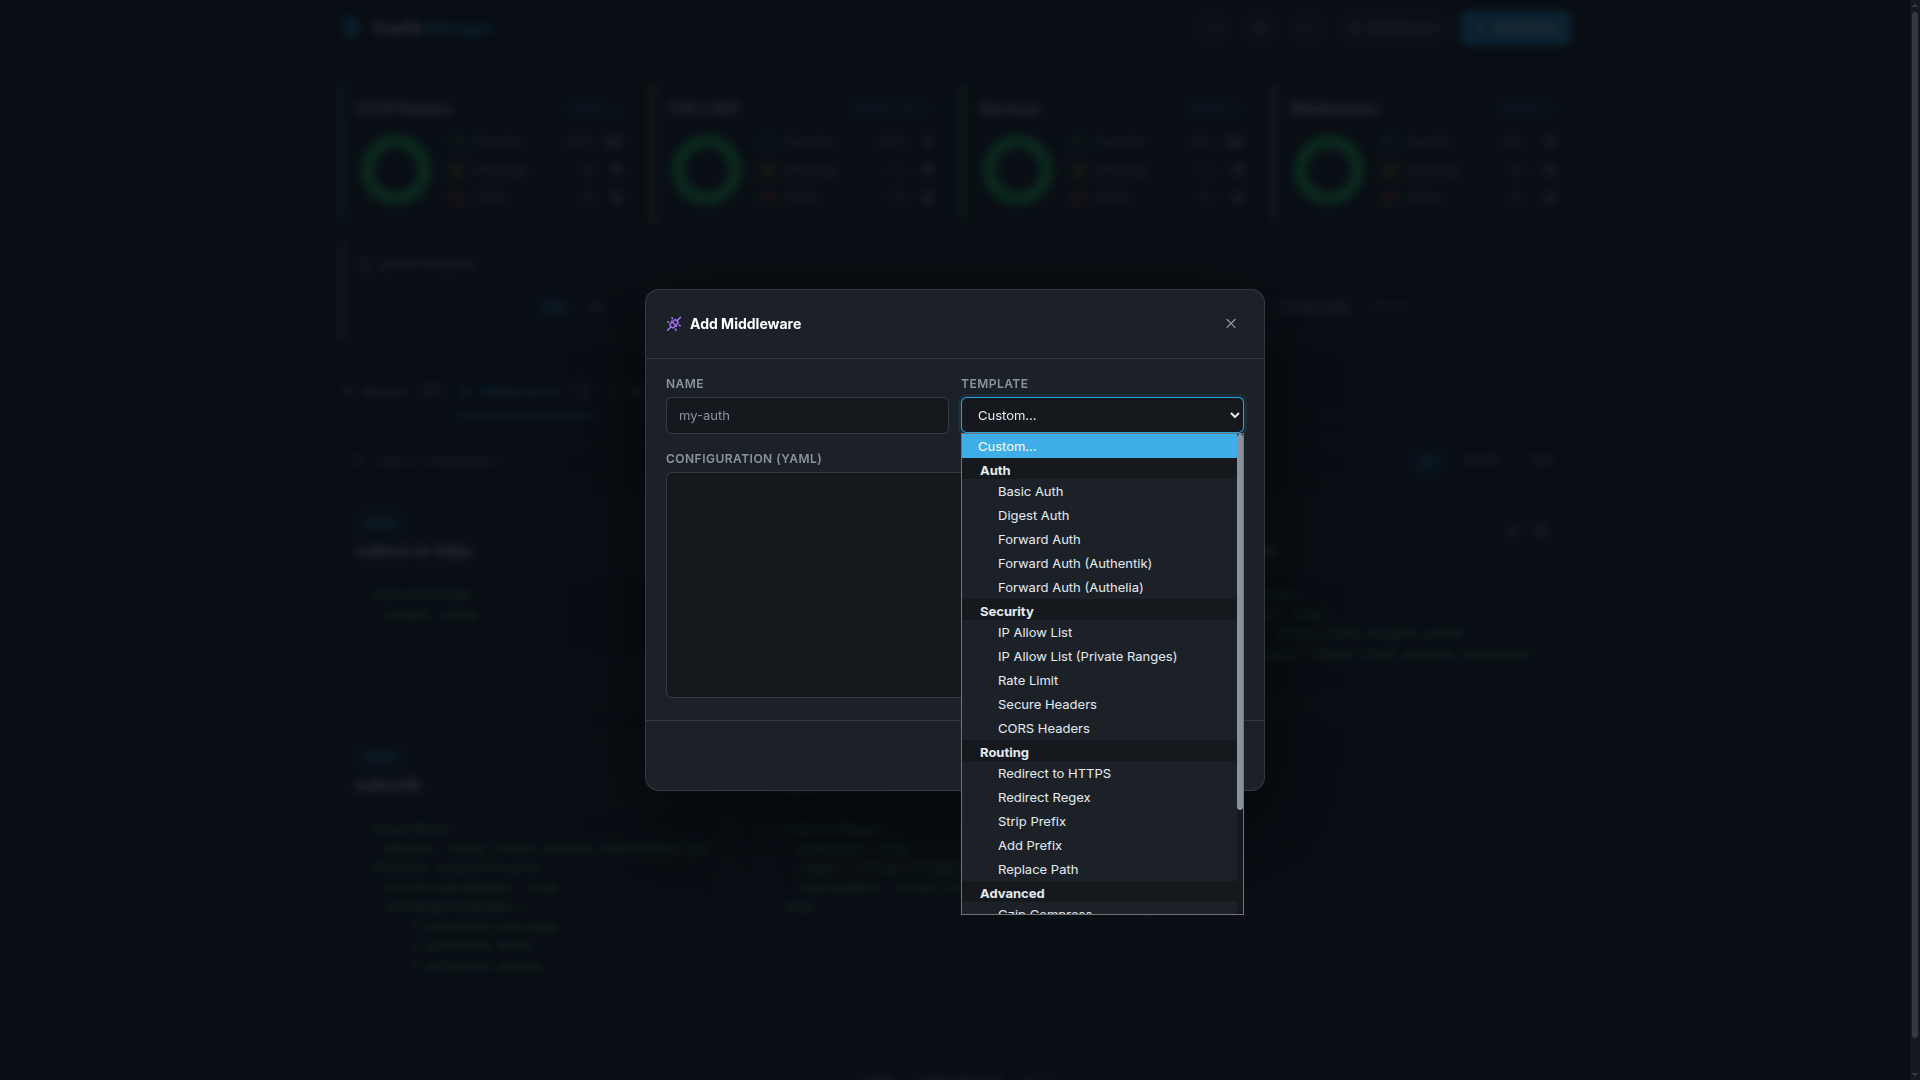
Middlewares
Middlewares modify requests before they reach your services - authentication, rate limiting, headers, redirects, and more.
Middleware List
Editing Middleware
Adding Middleware
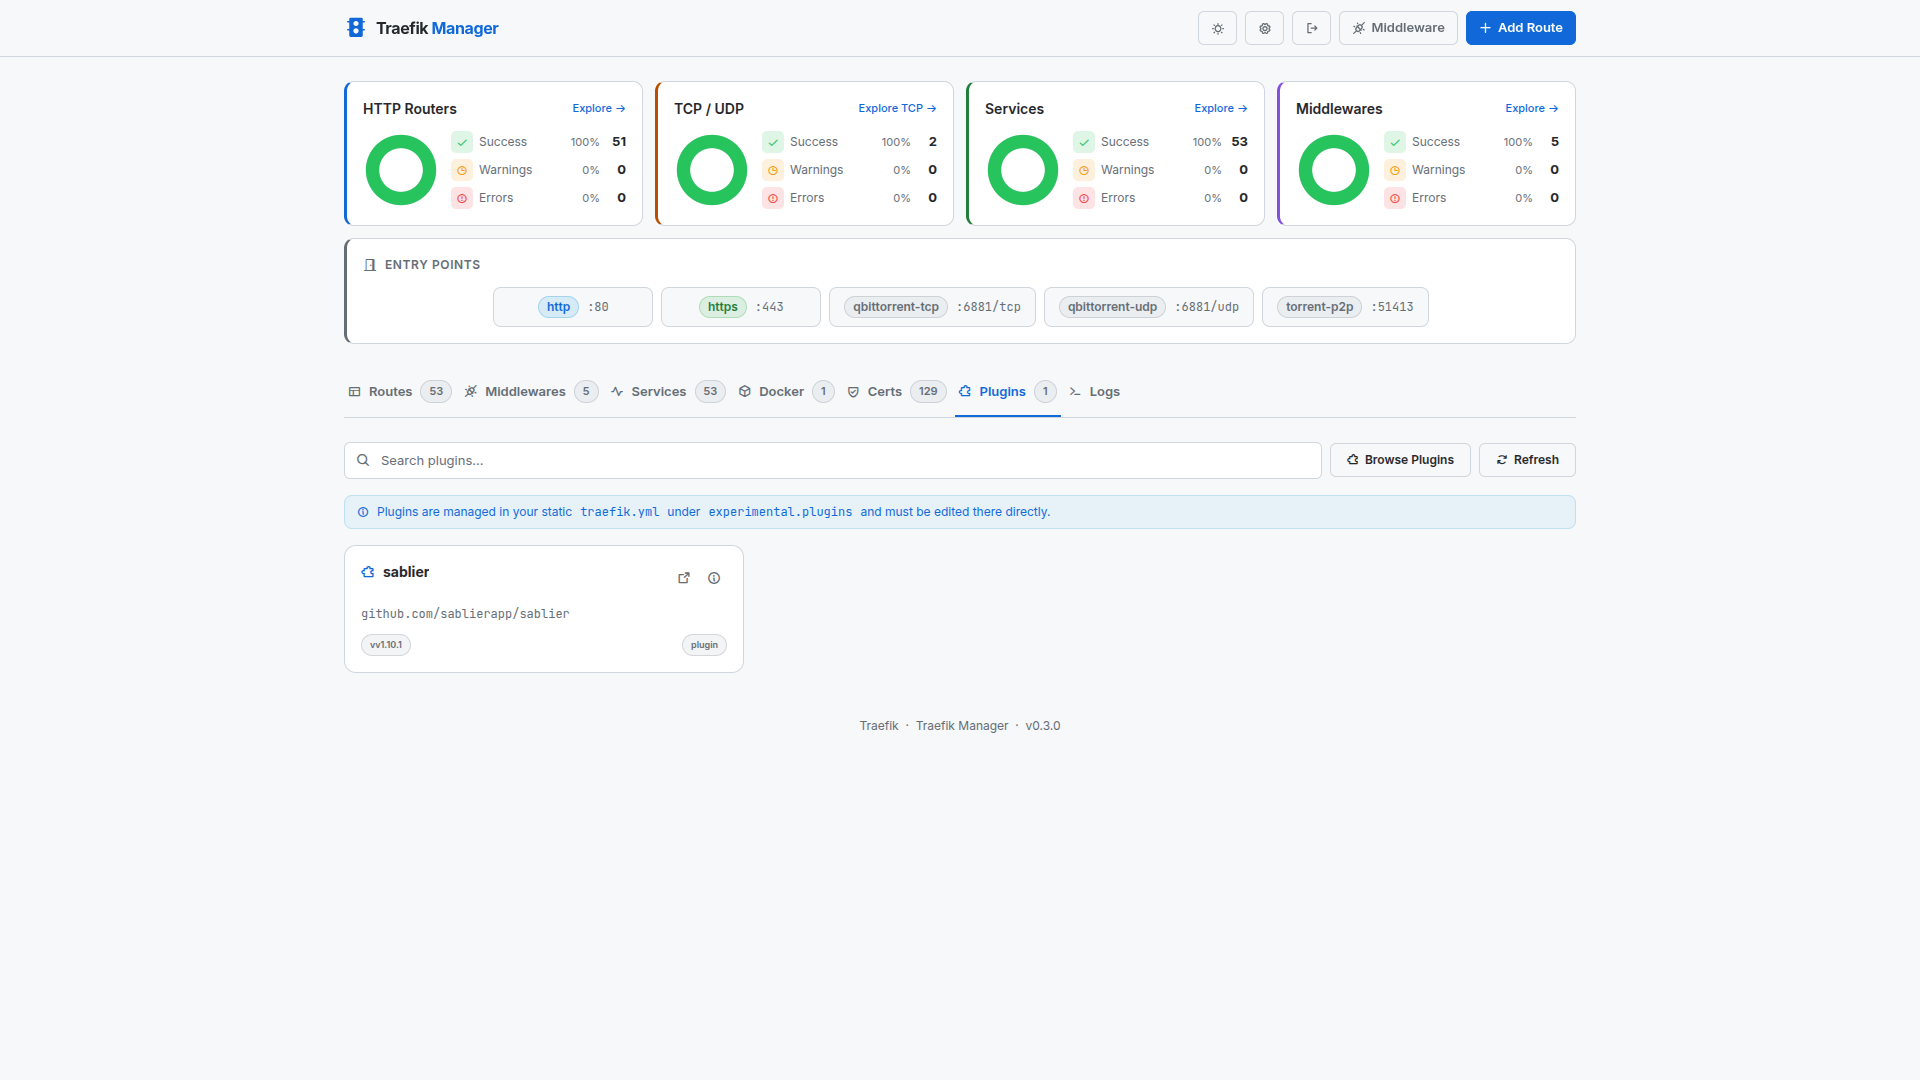
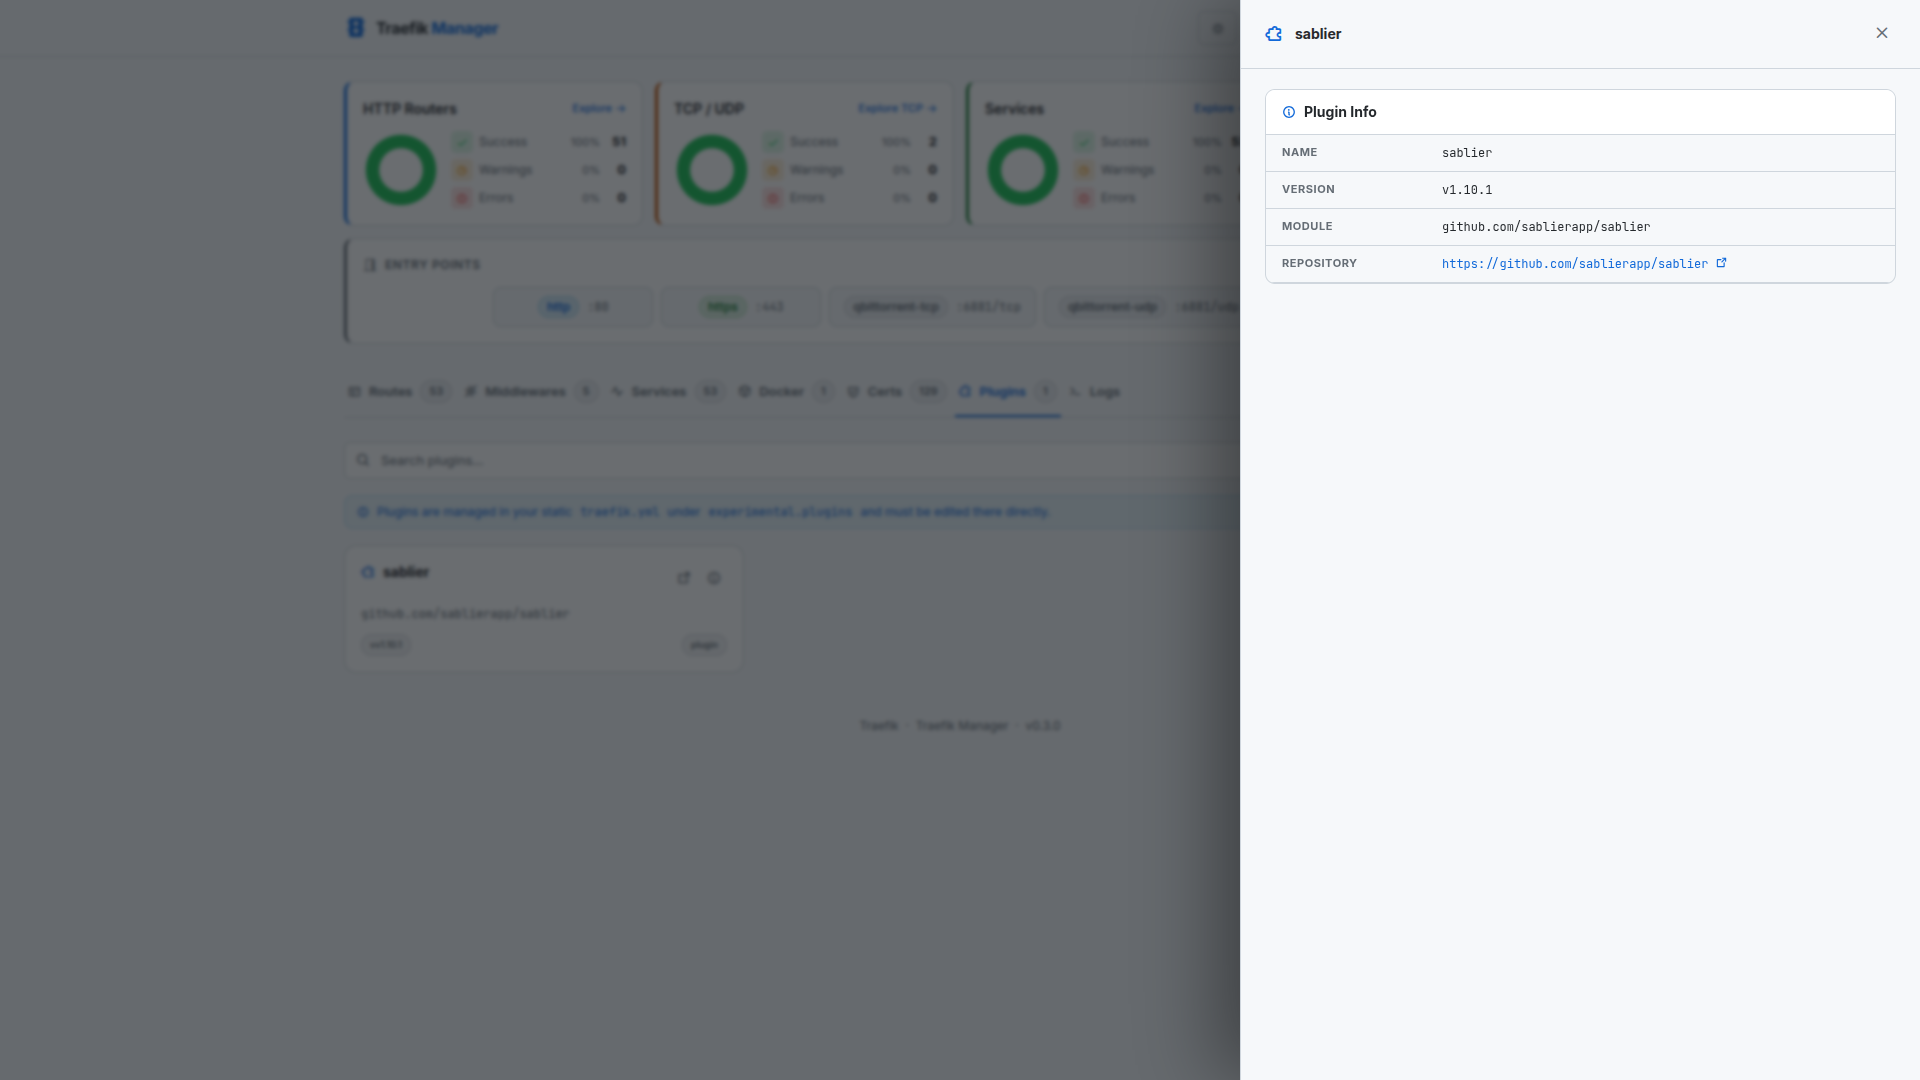
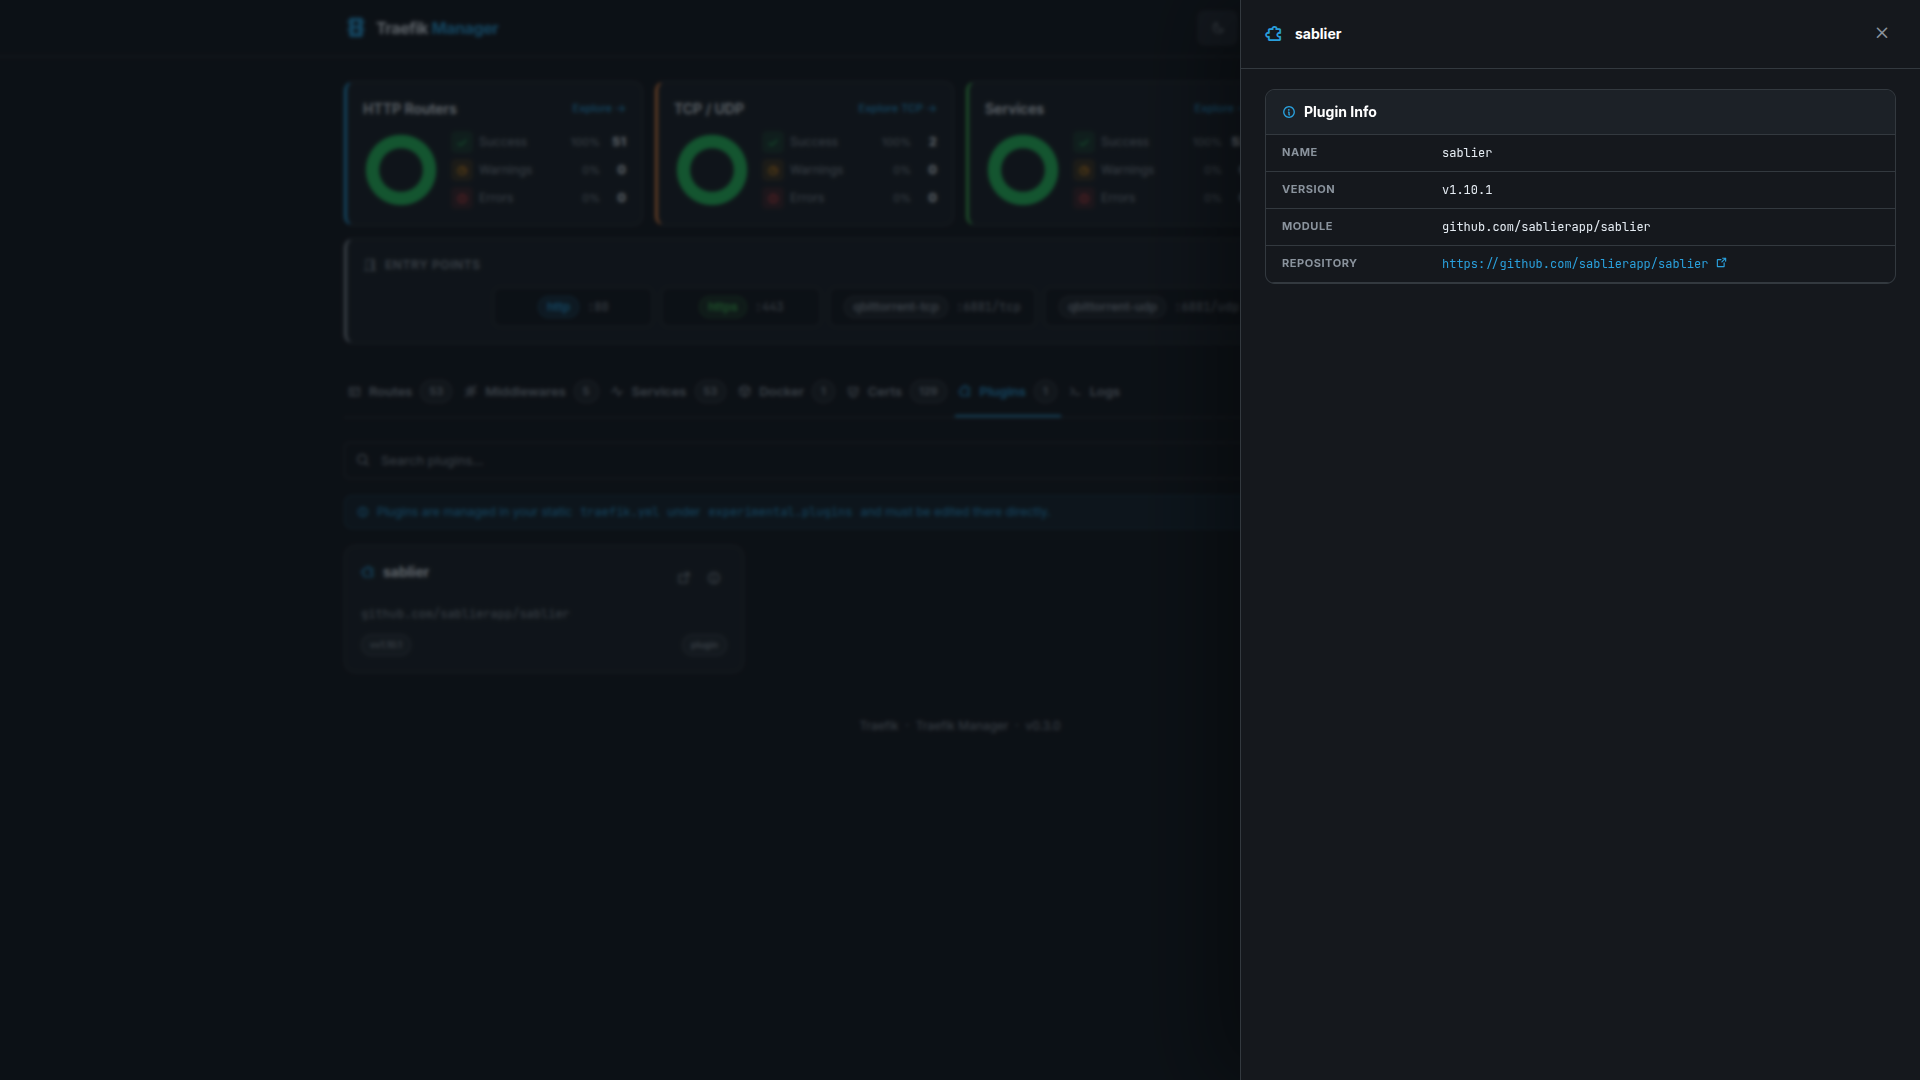
Plugins
View and monitor active Traefik plugins.
Plugin List
Plugin Details
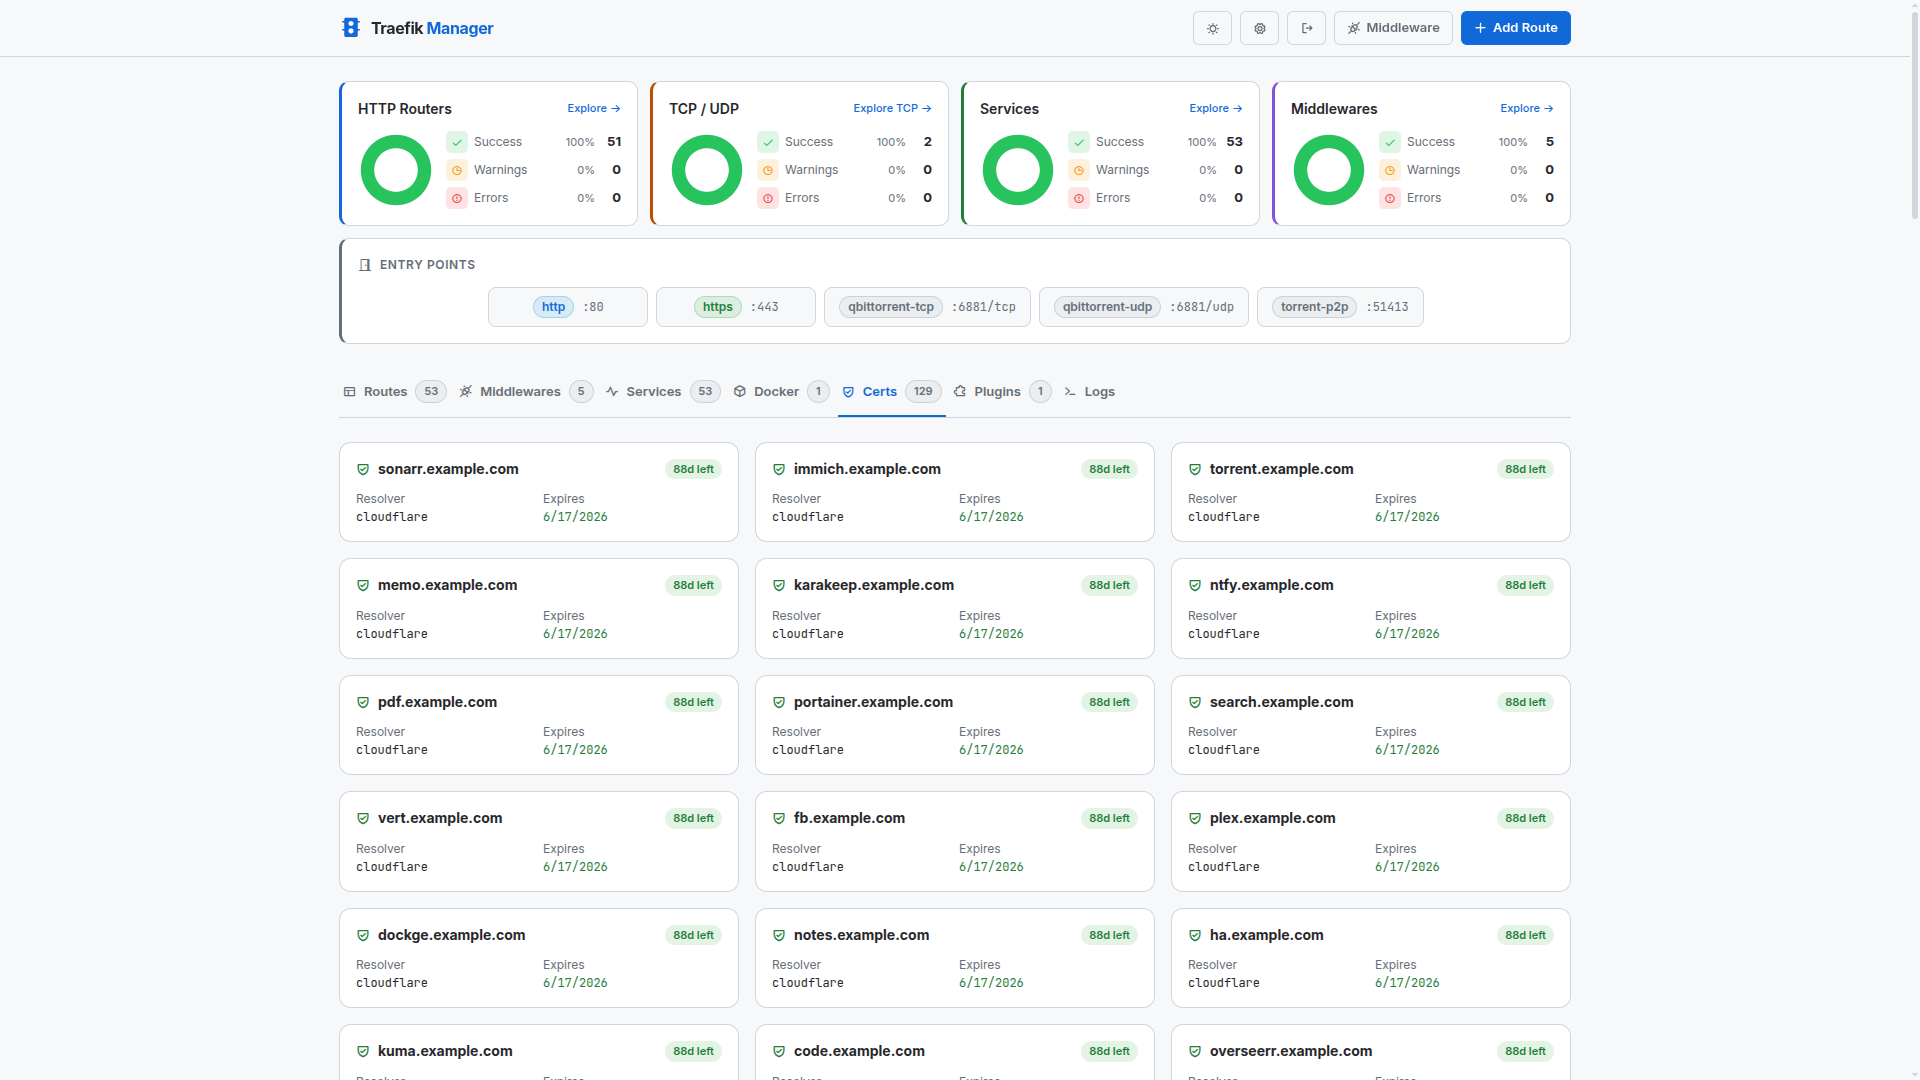
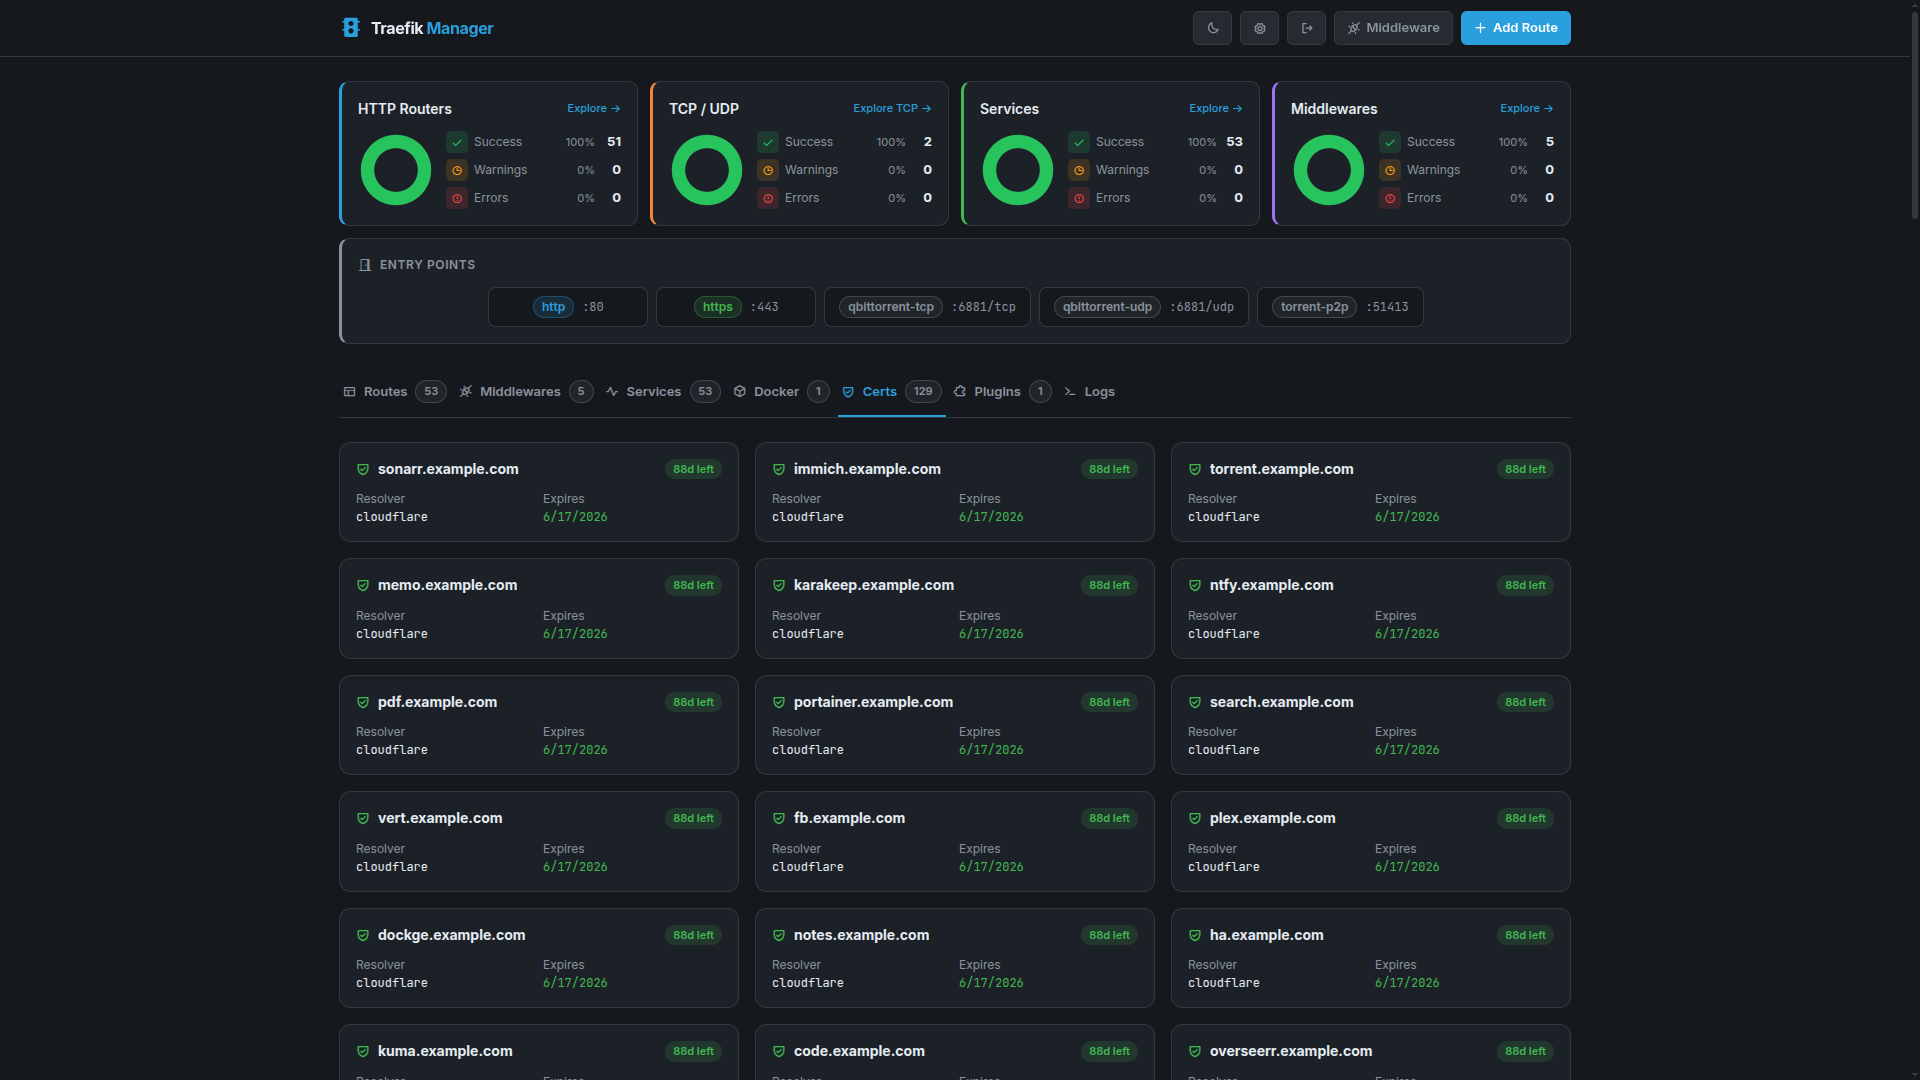
Certificates
View and monitor TLS certificates managed by Traefik.
Certificates View
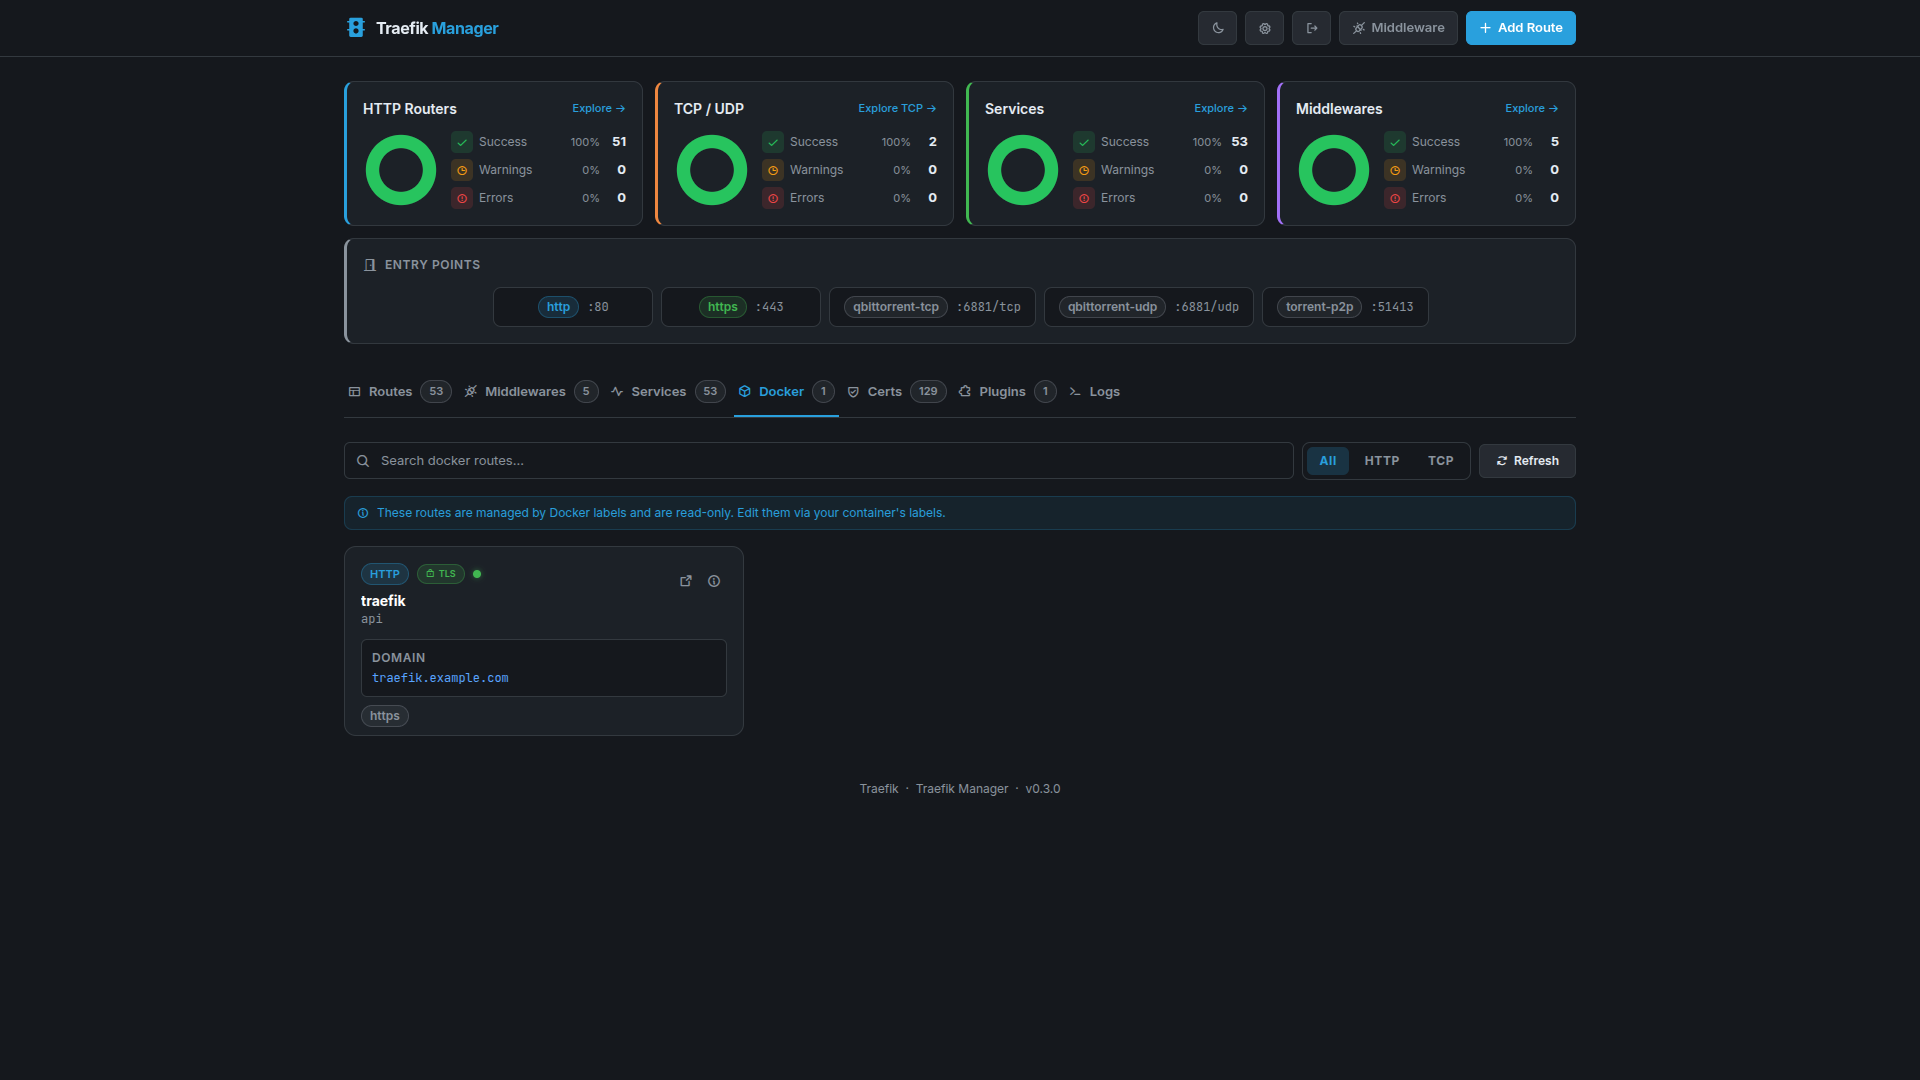
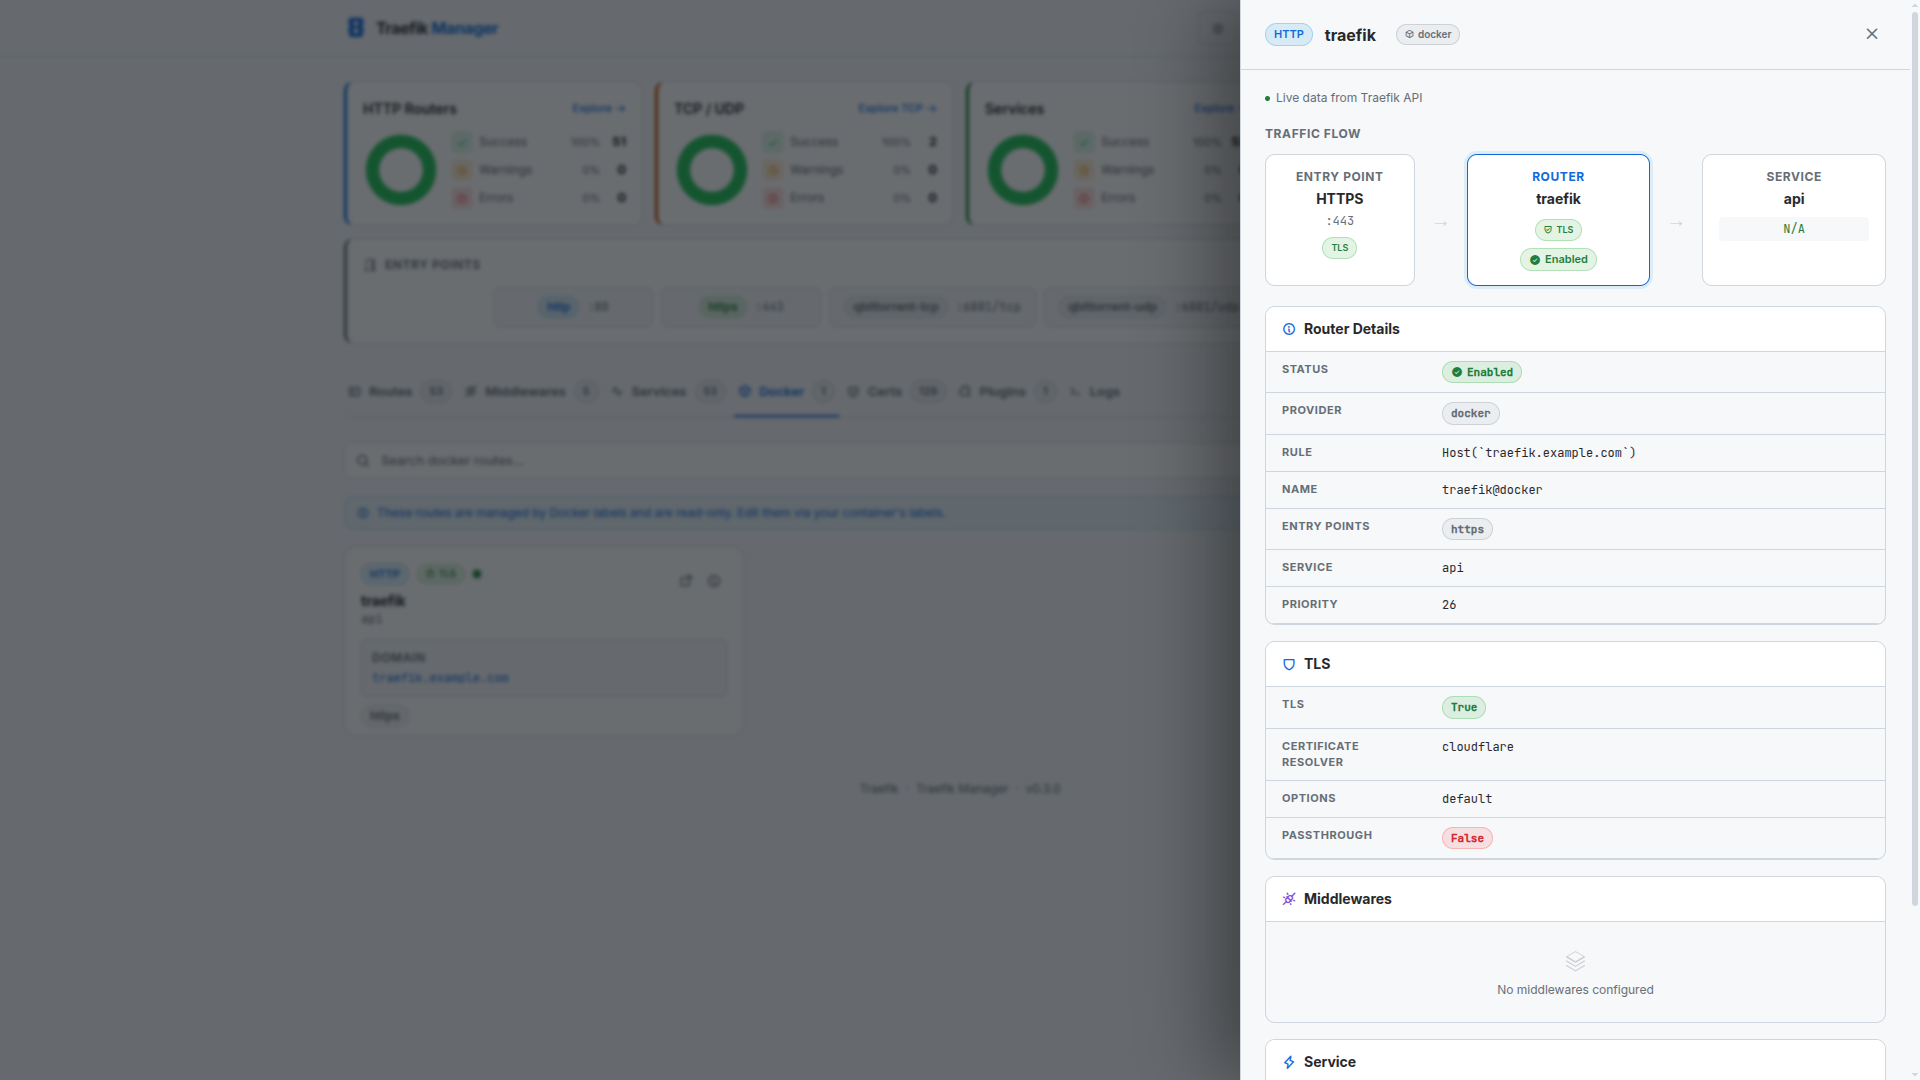
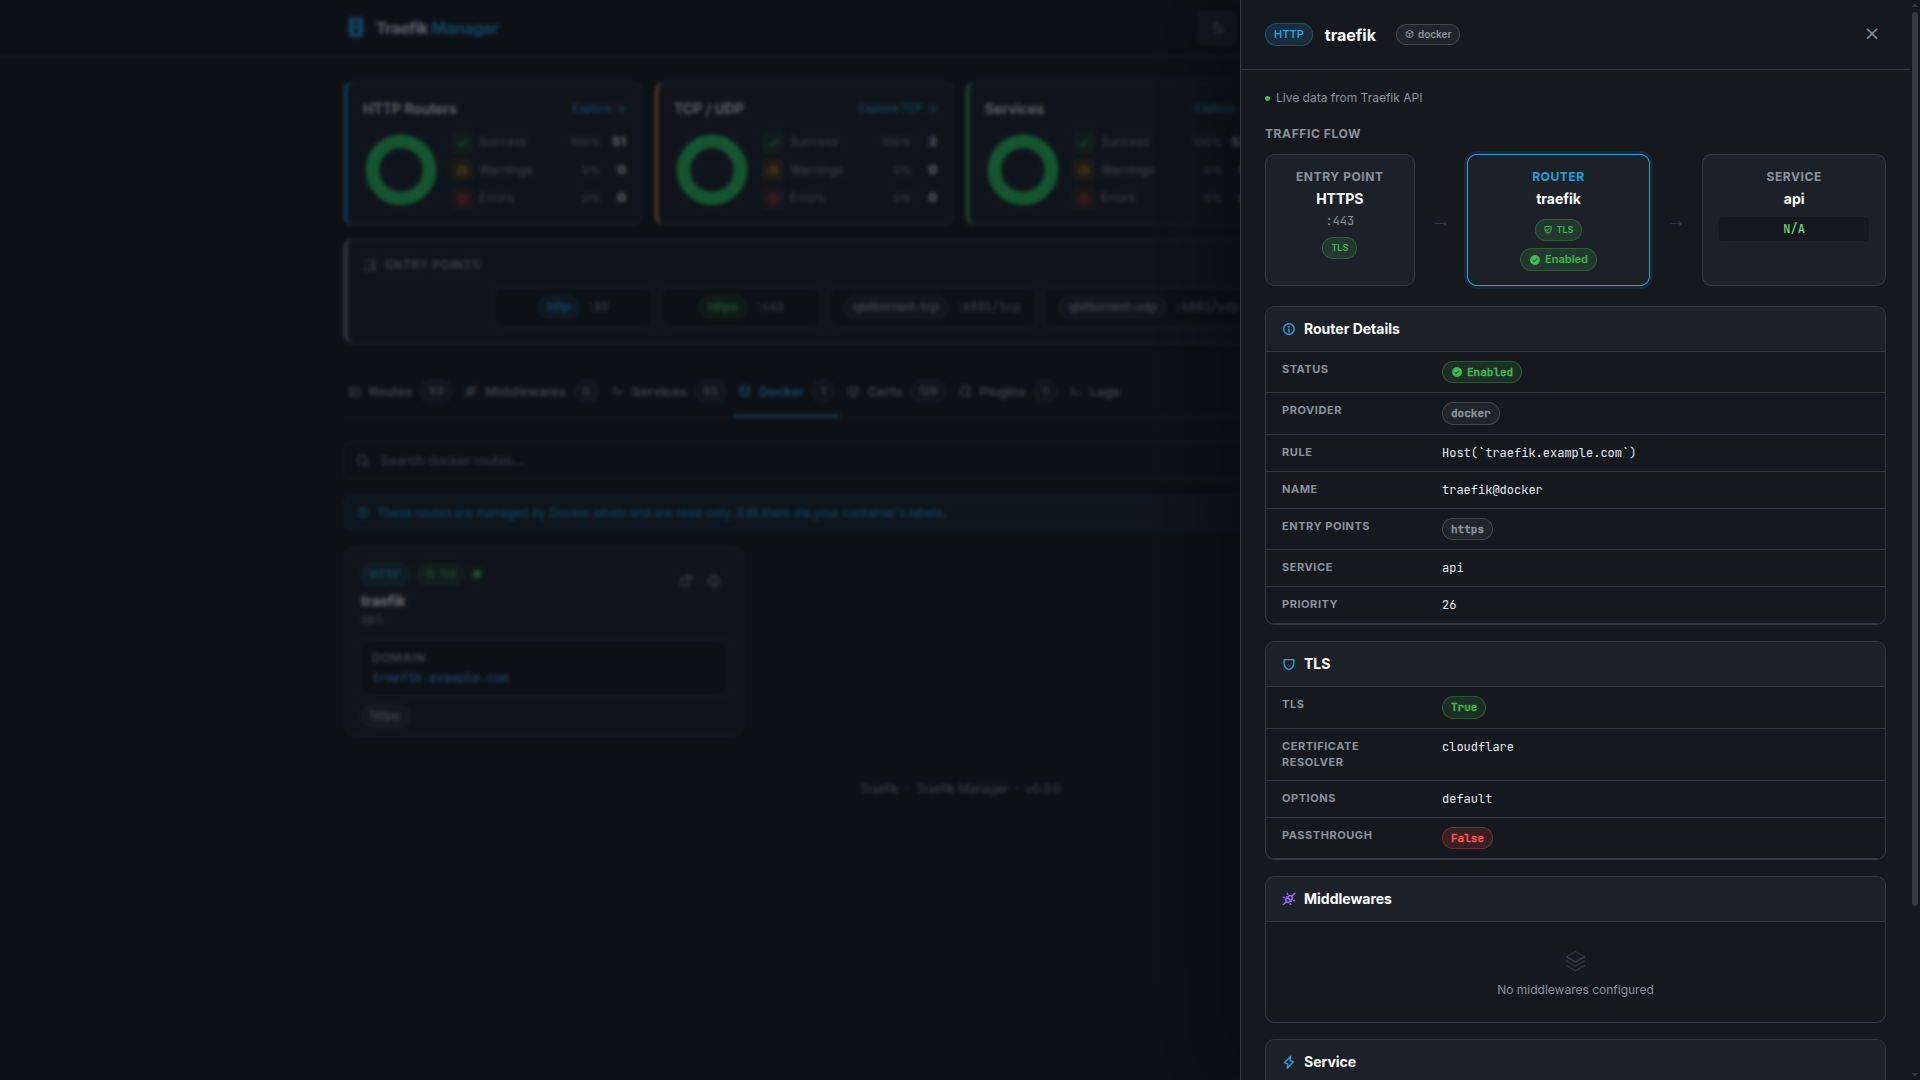
Docker
Inspect routes and services discovered via the Docker provider, including container labels and health state.
Docker Routes
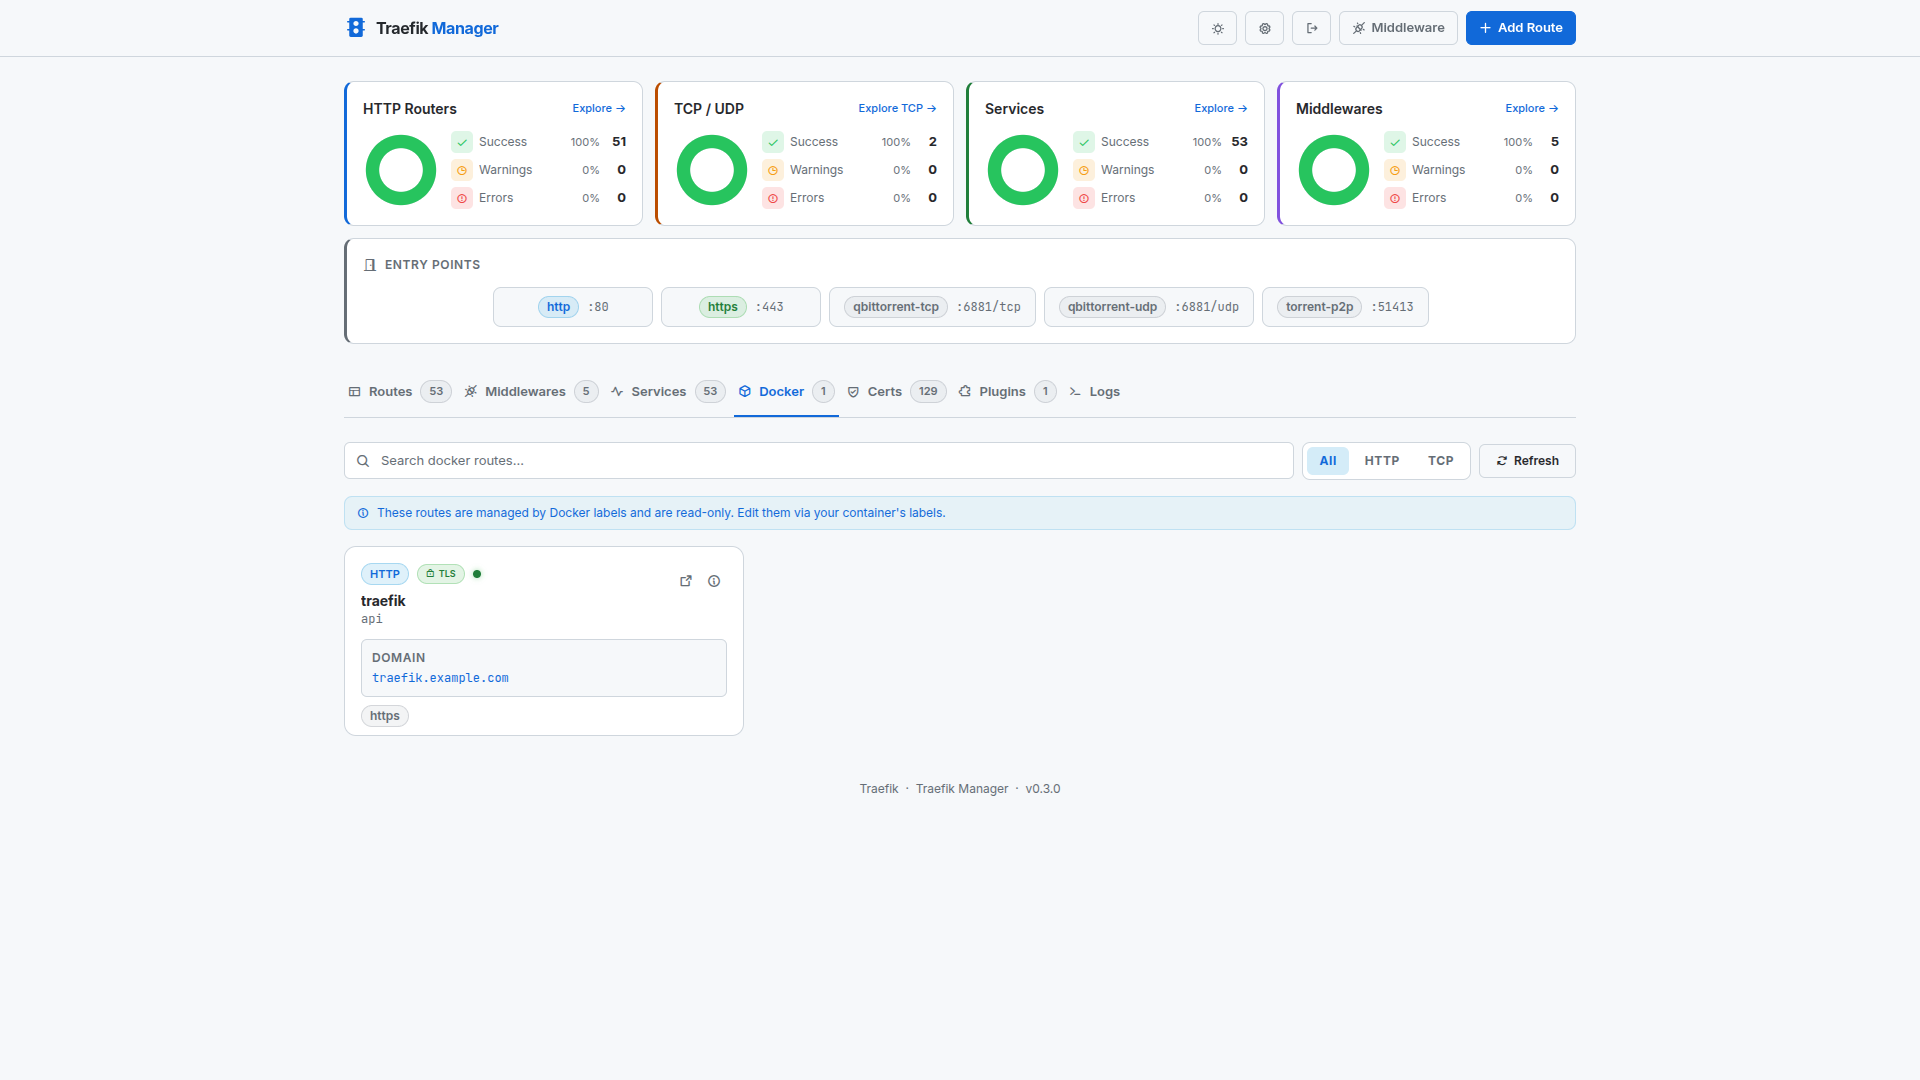
Docker Route Details
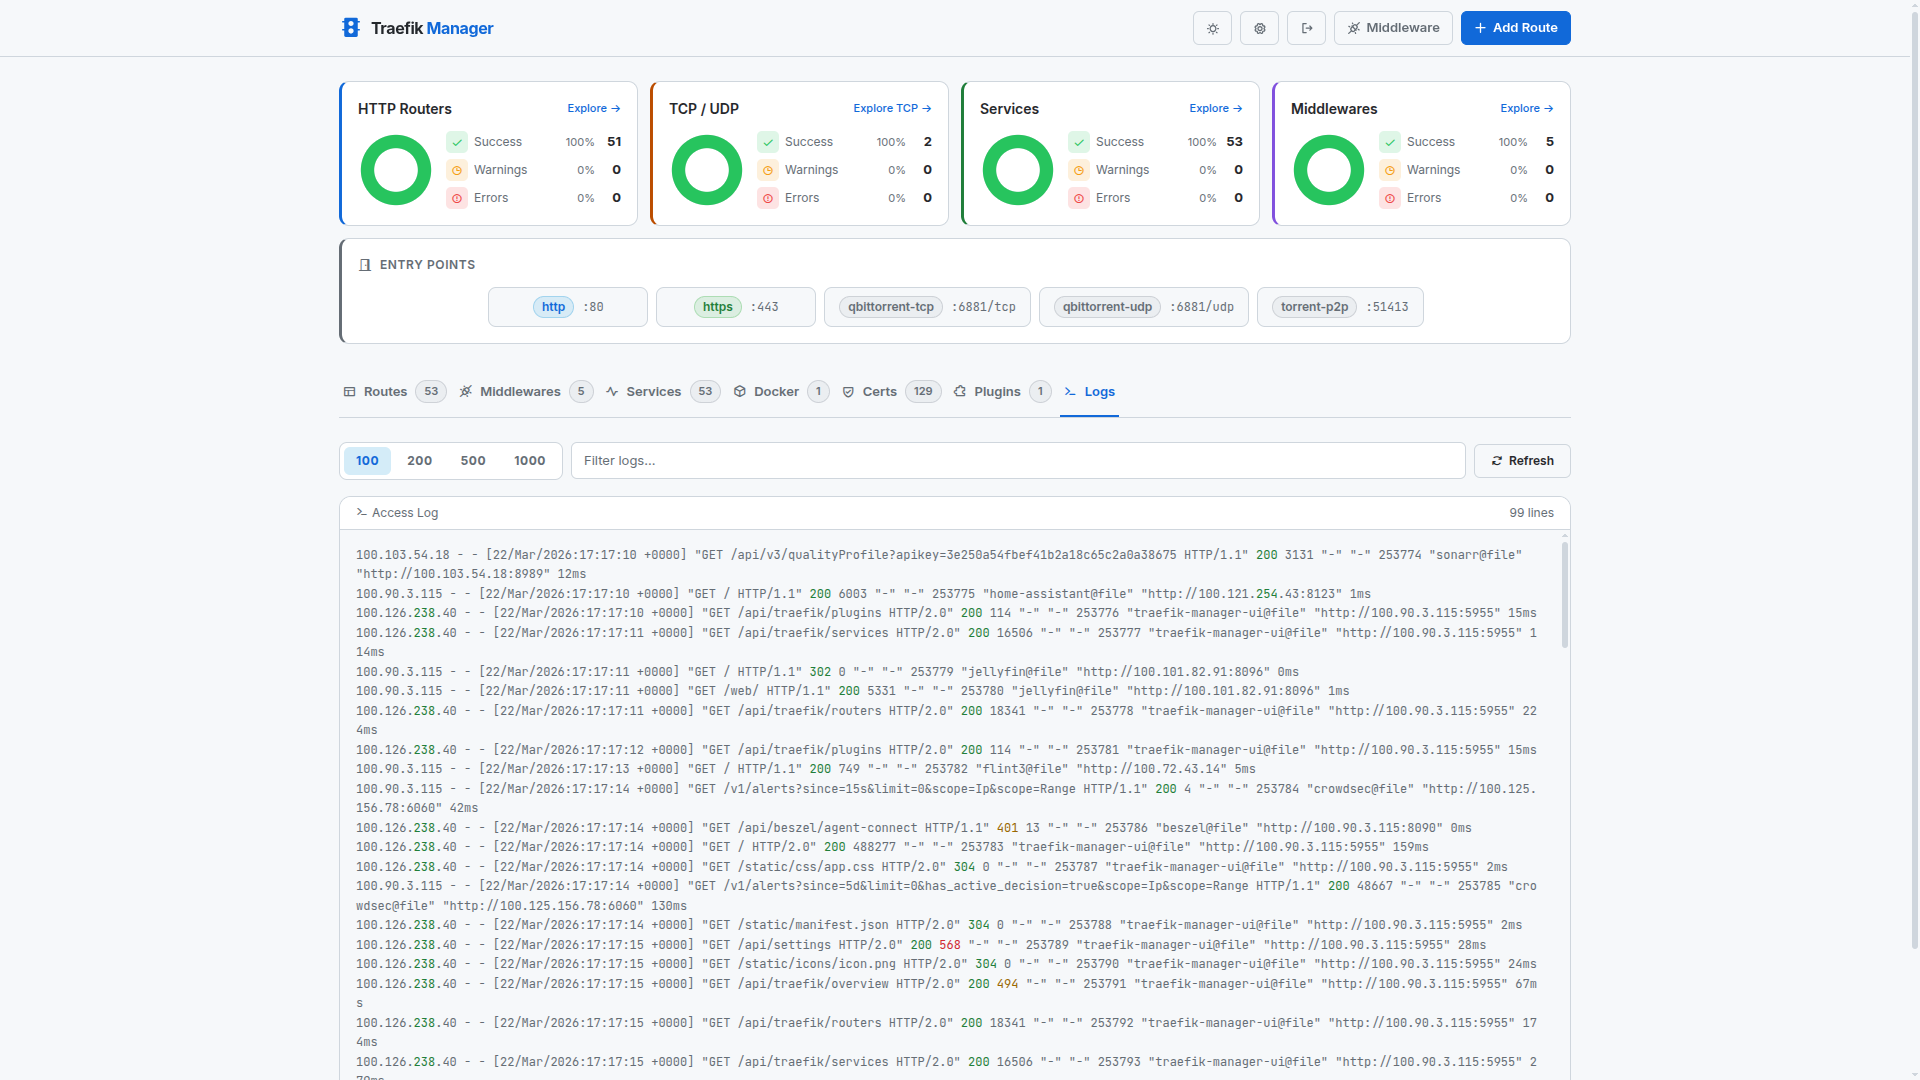
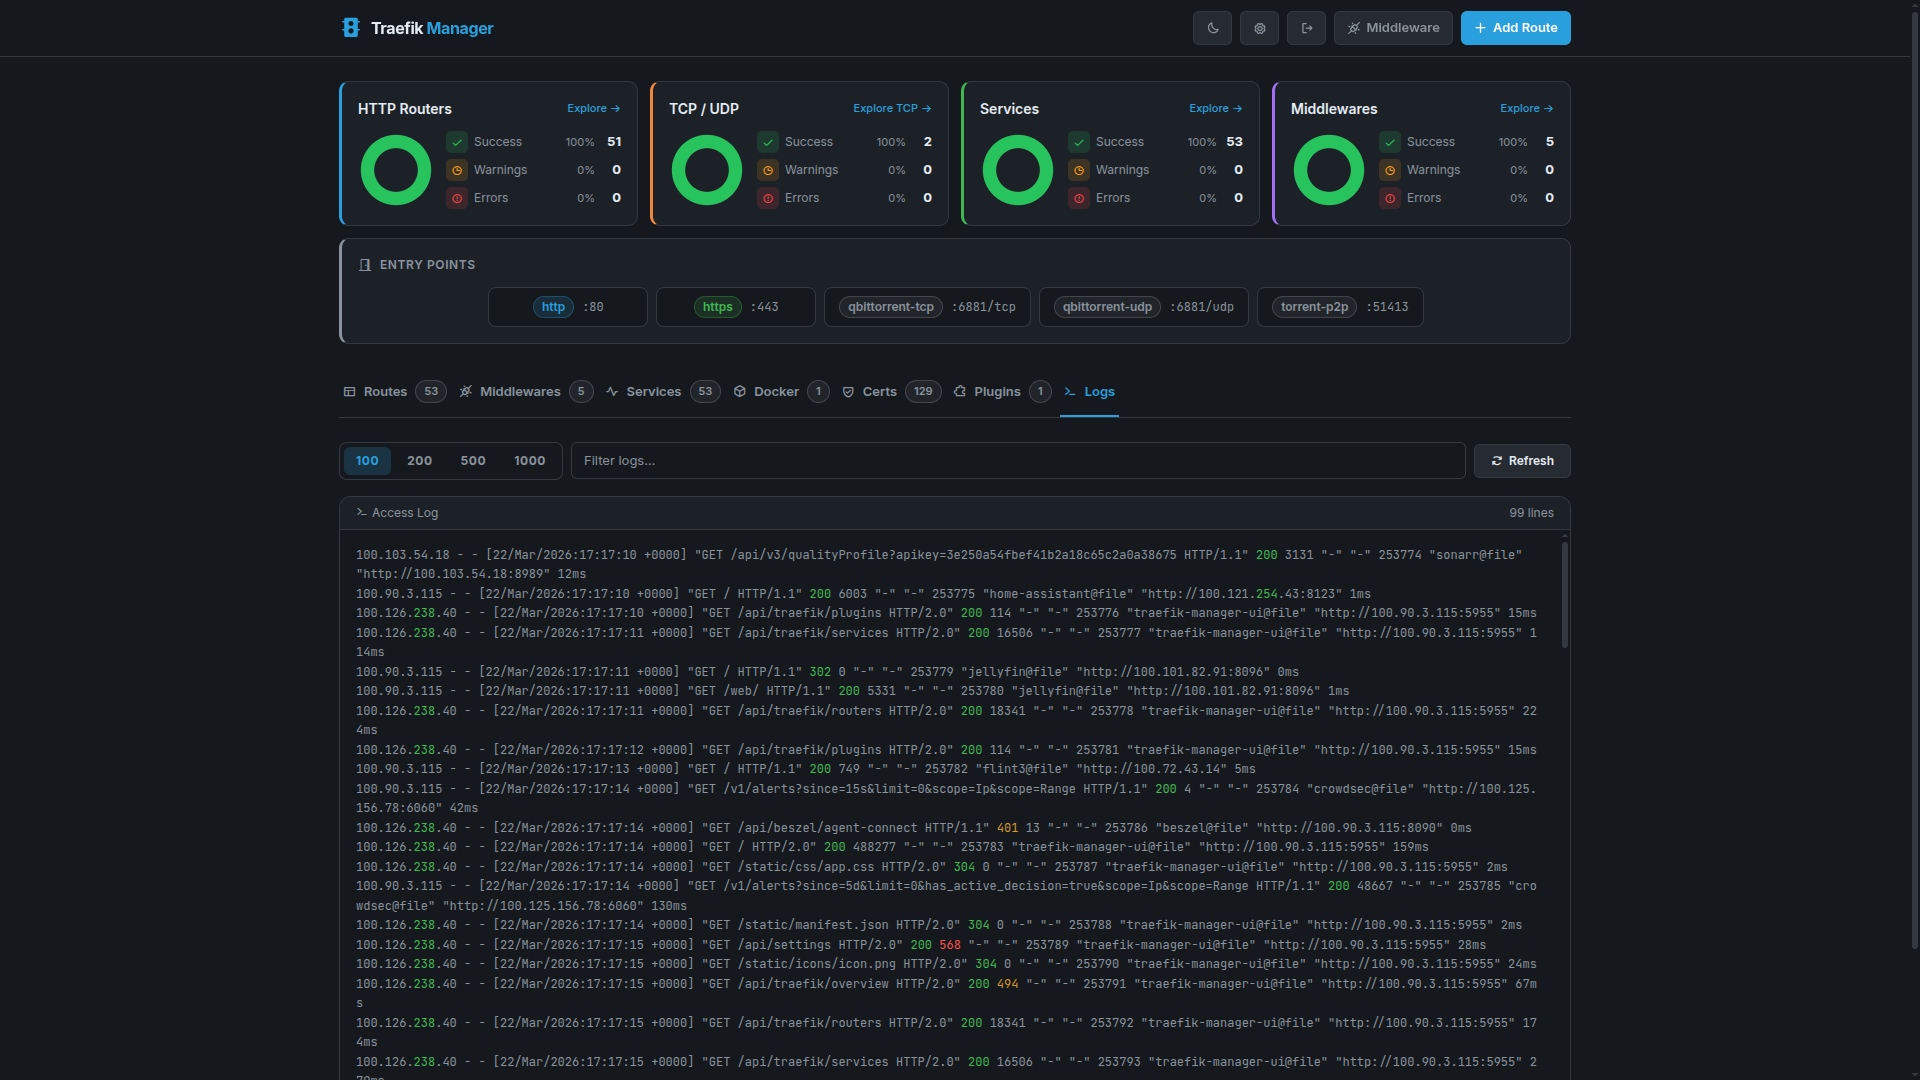
Logs
Live and historical Traefik access logs with line-count control and filtering.
Logs View
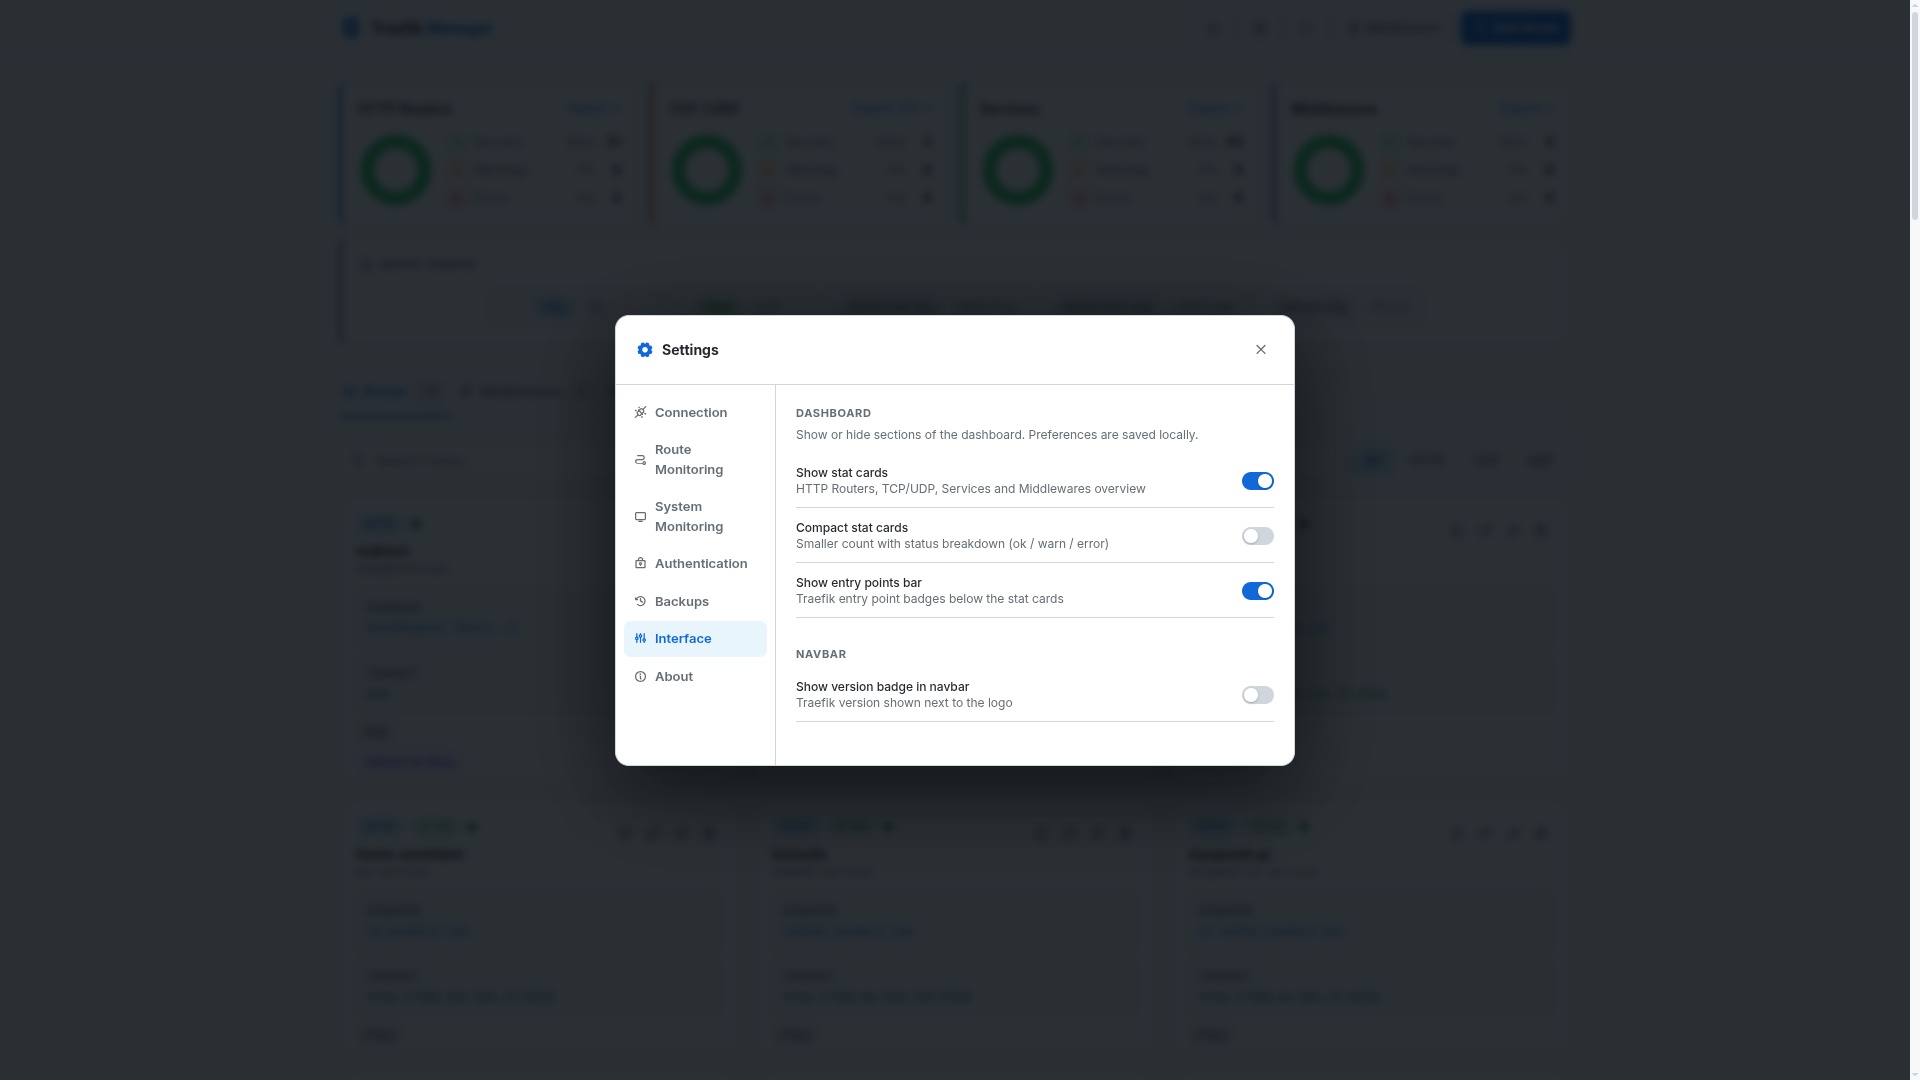
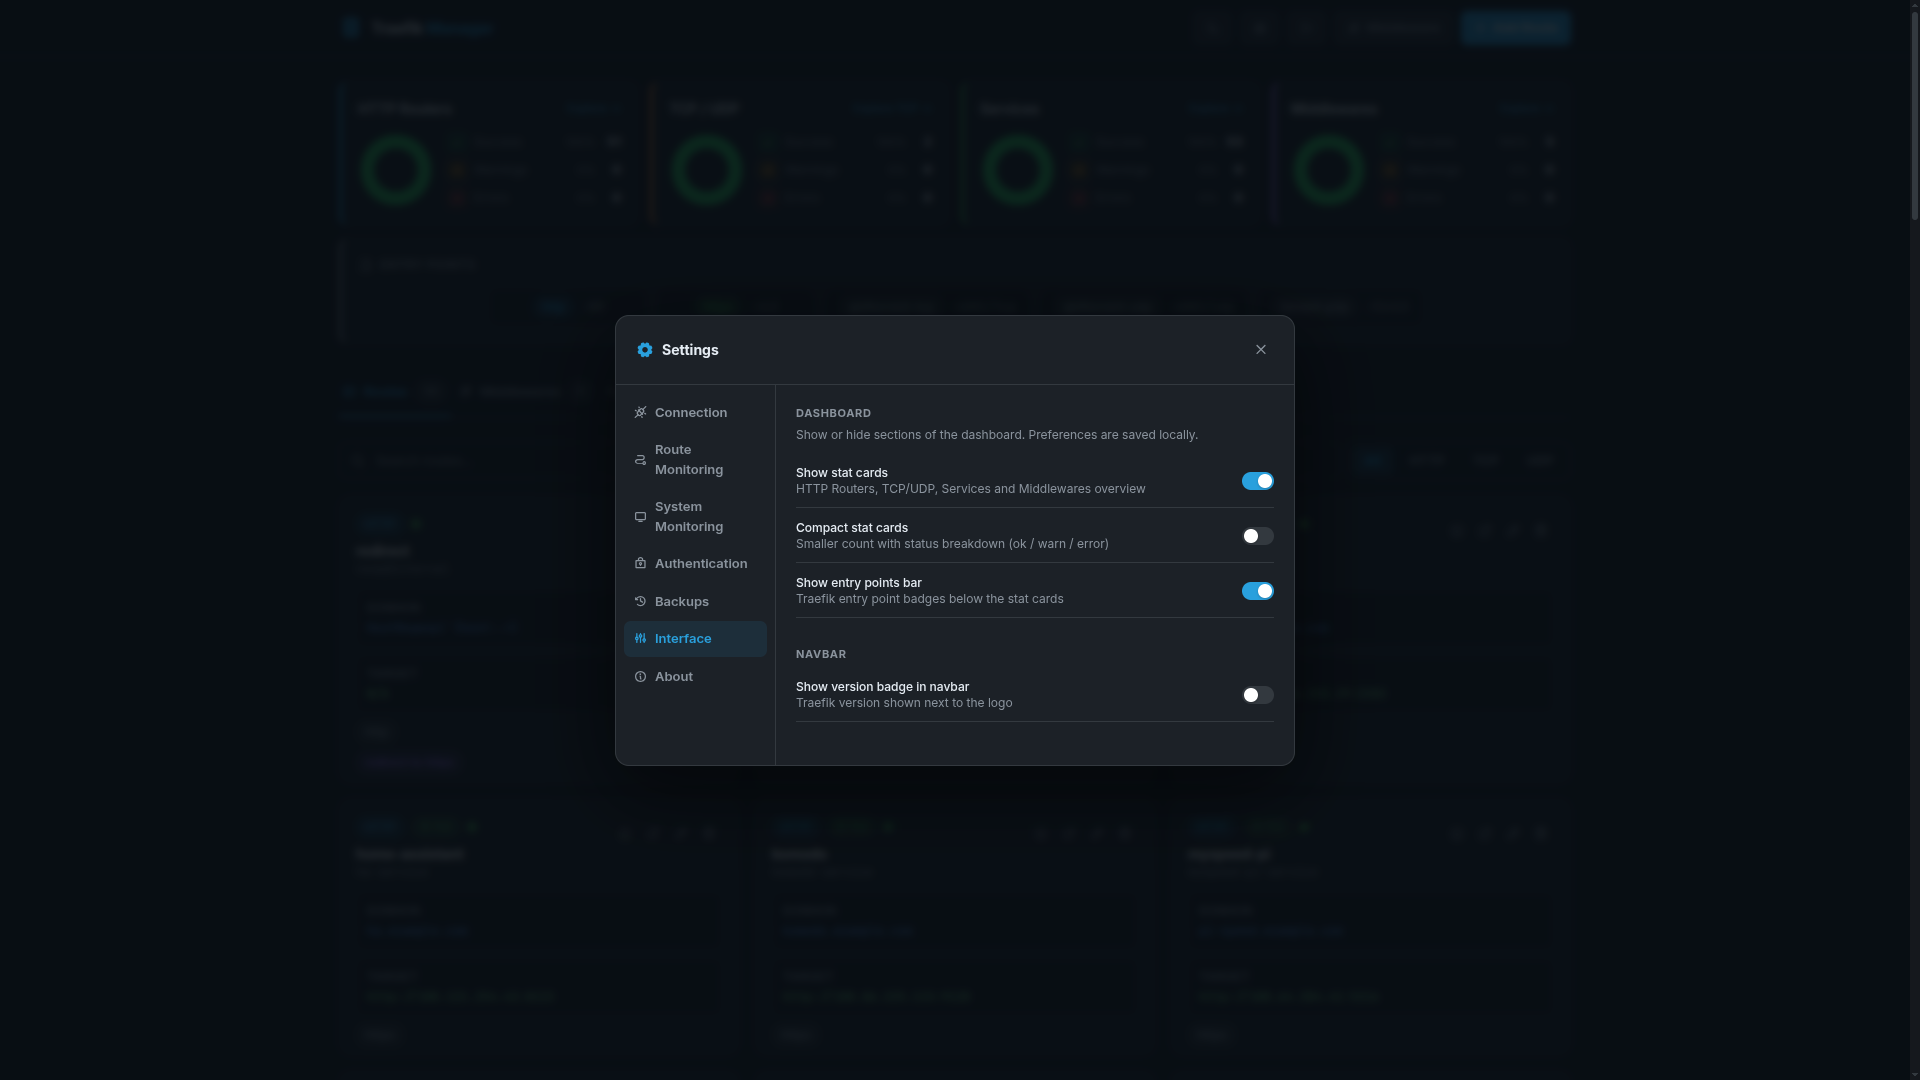
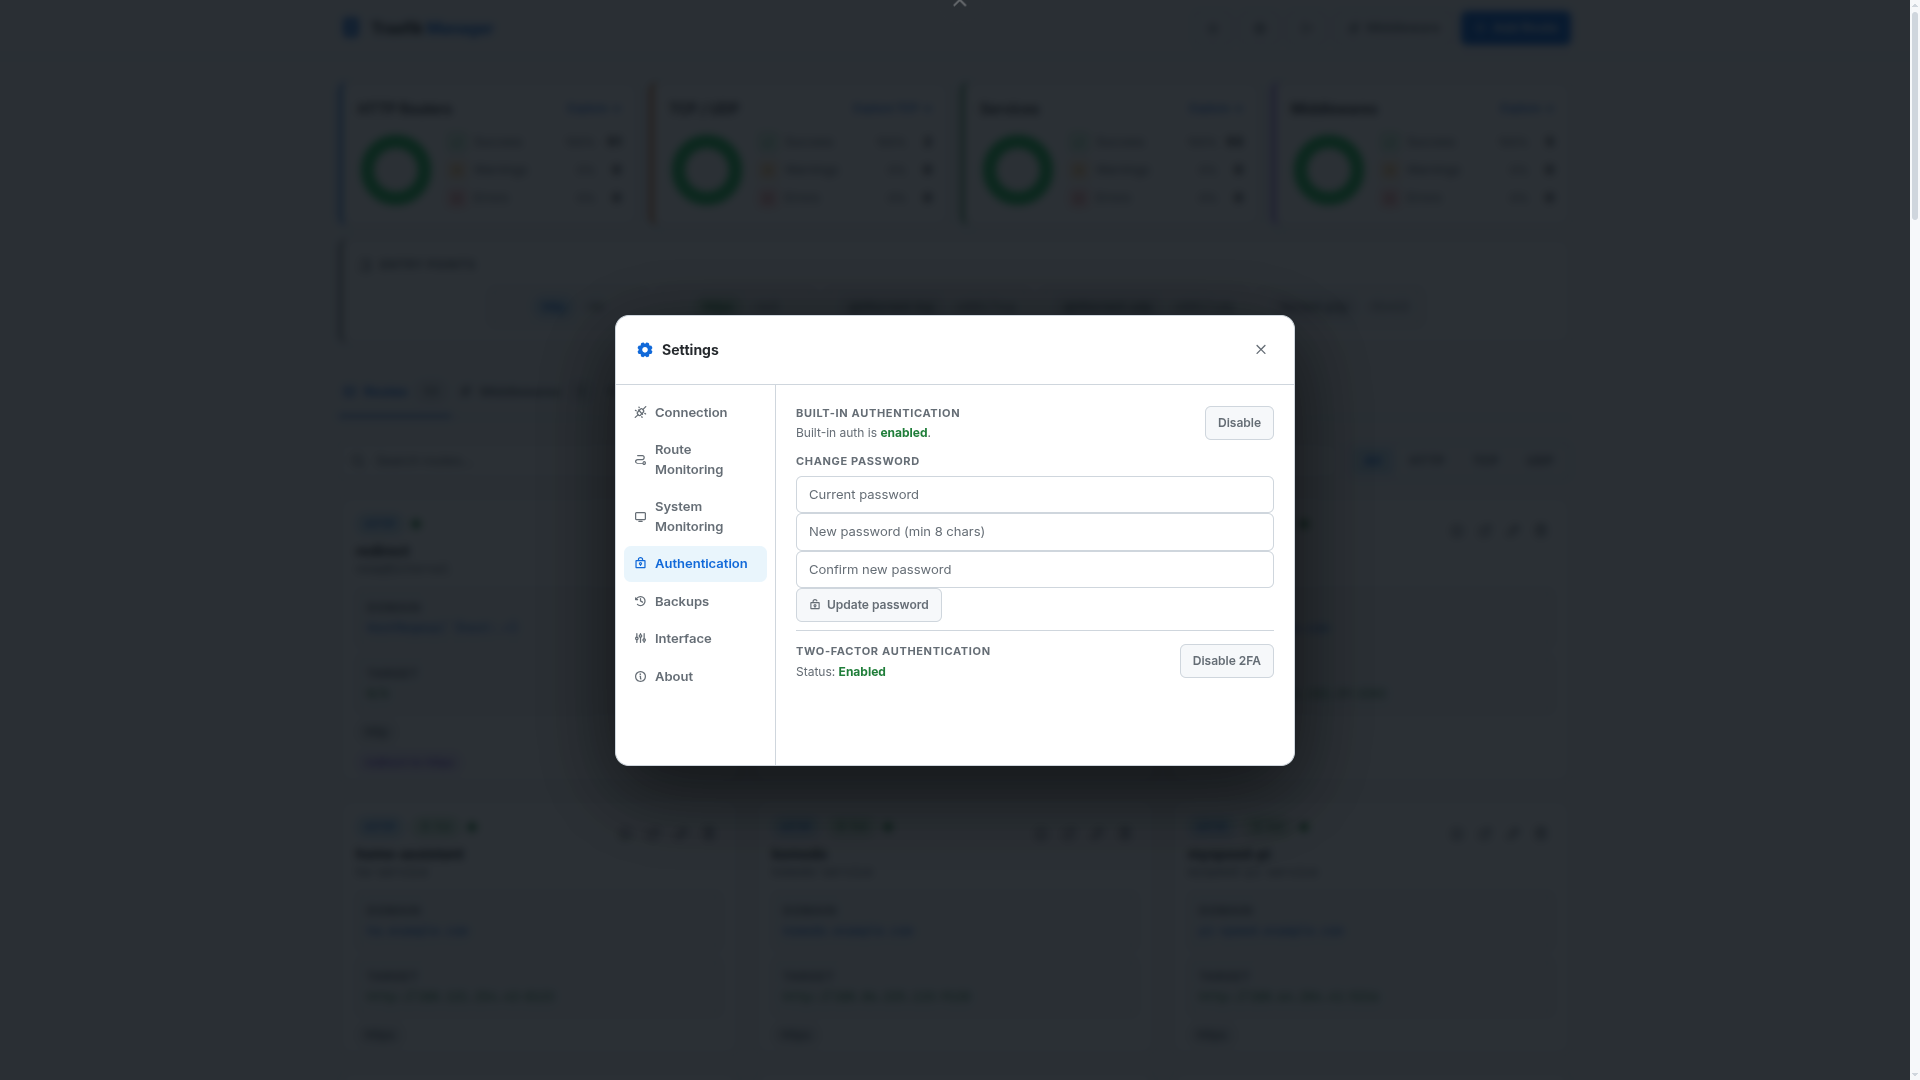
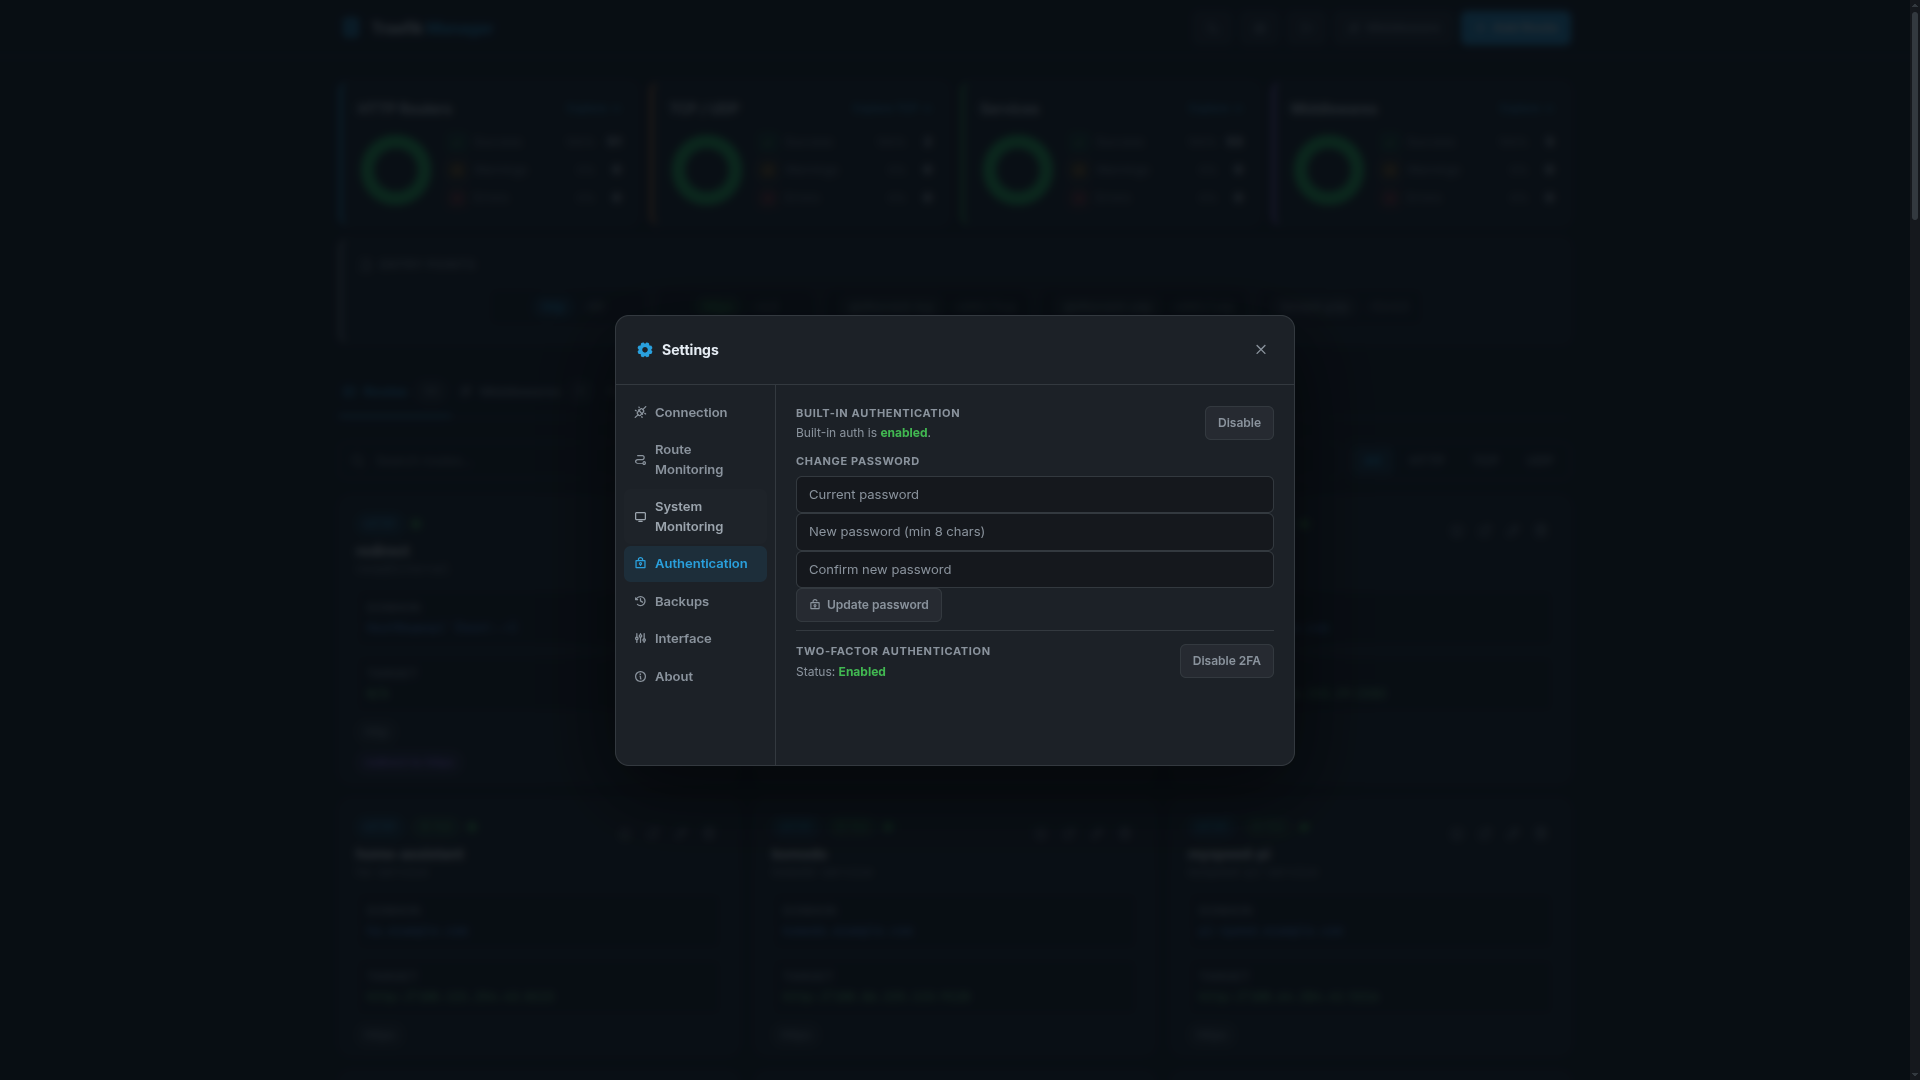
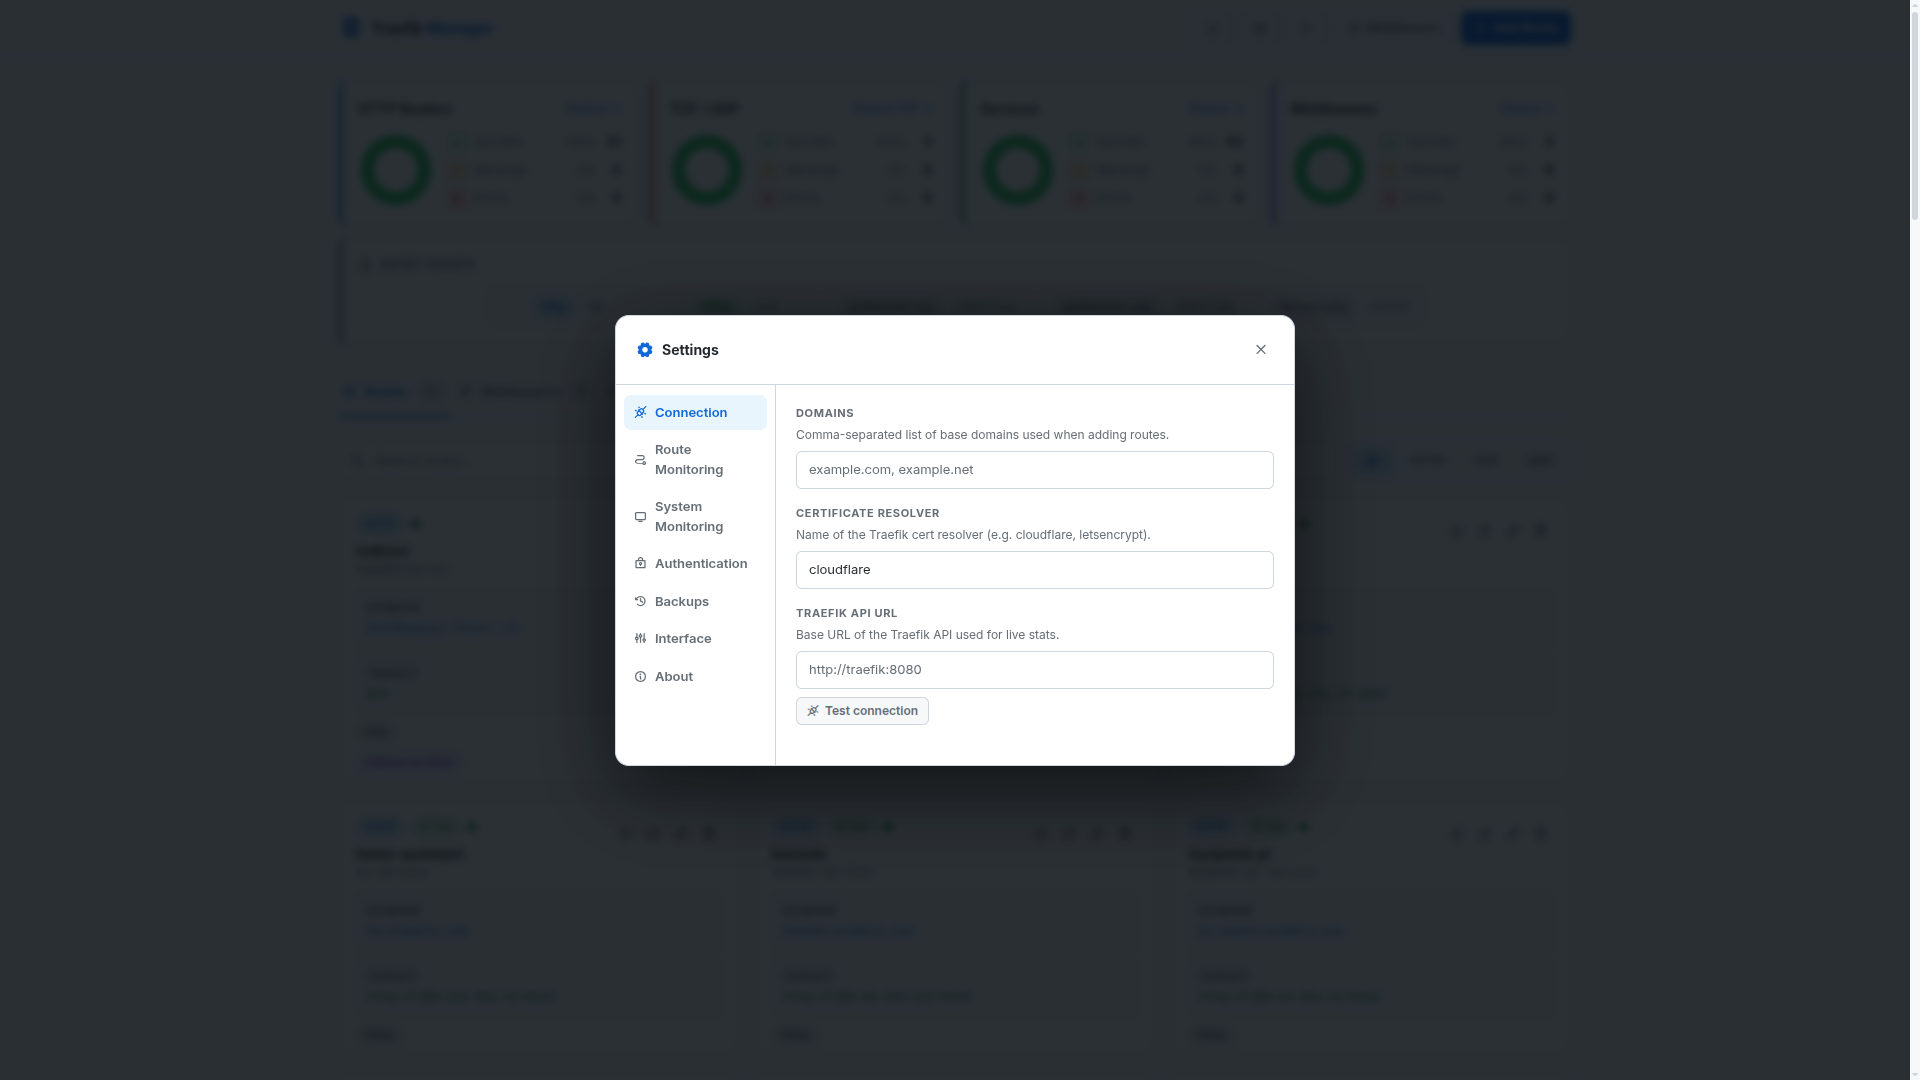
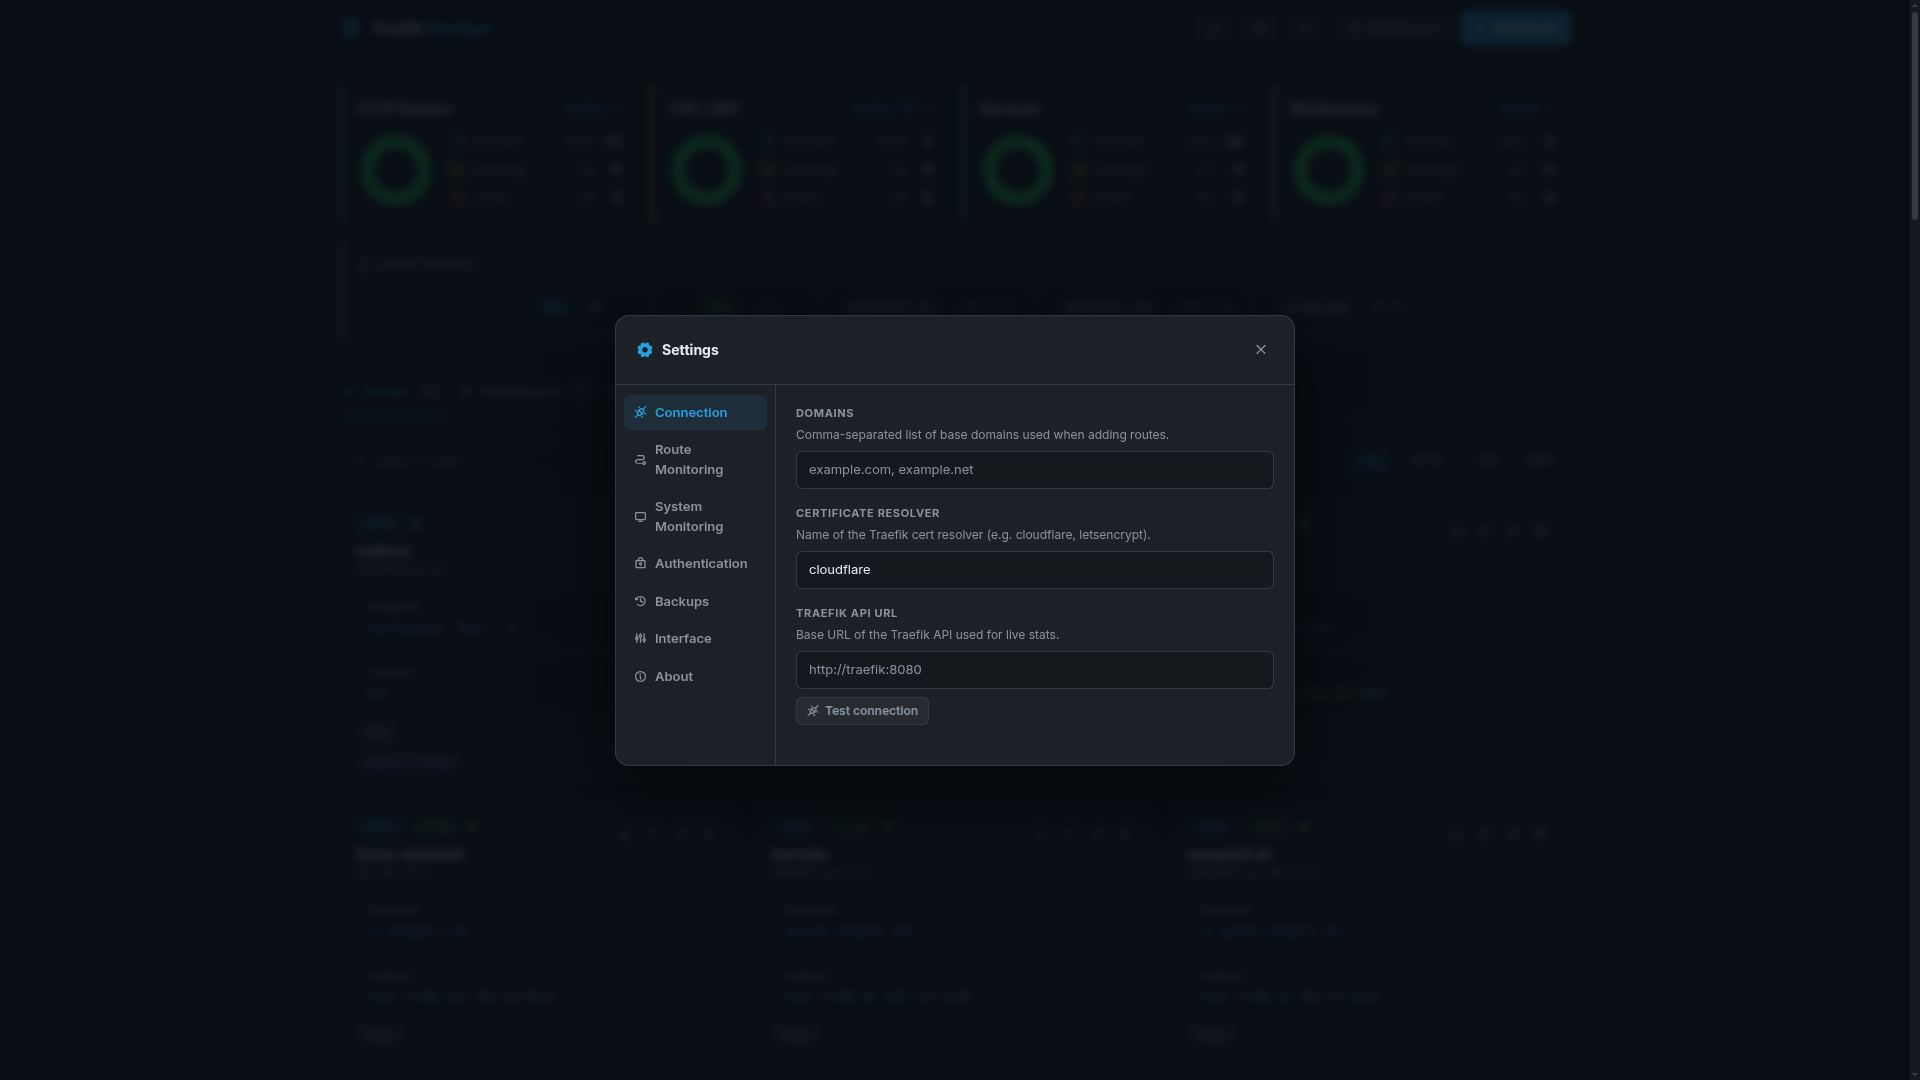
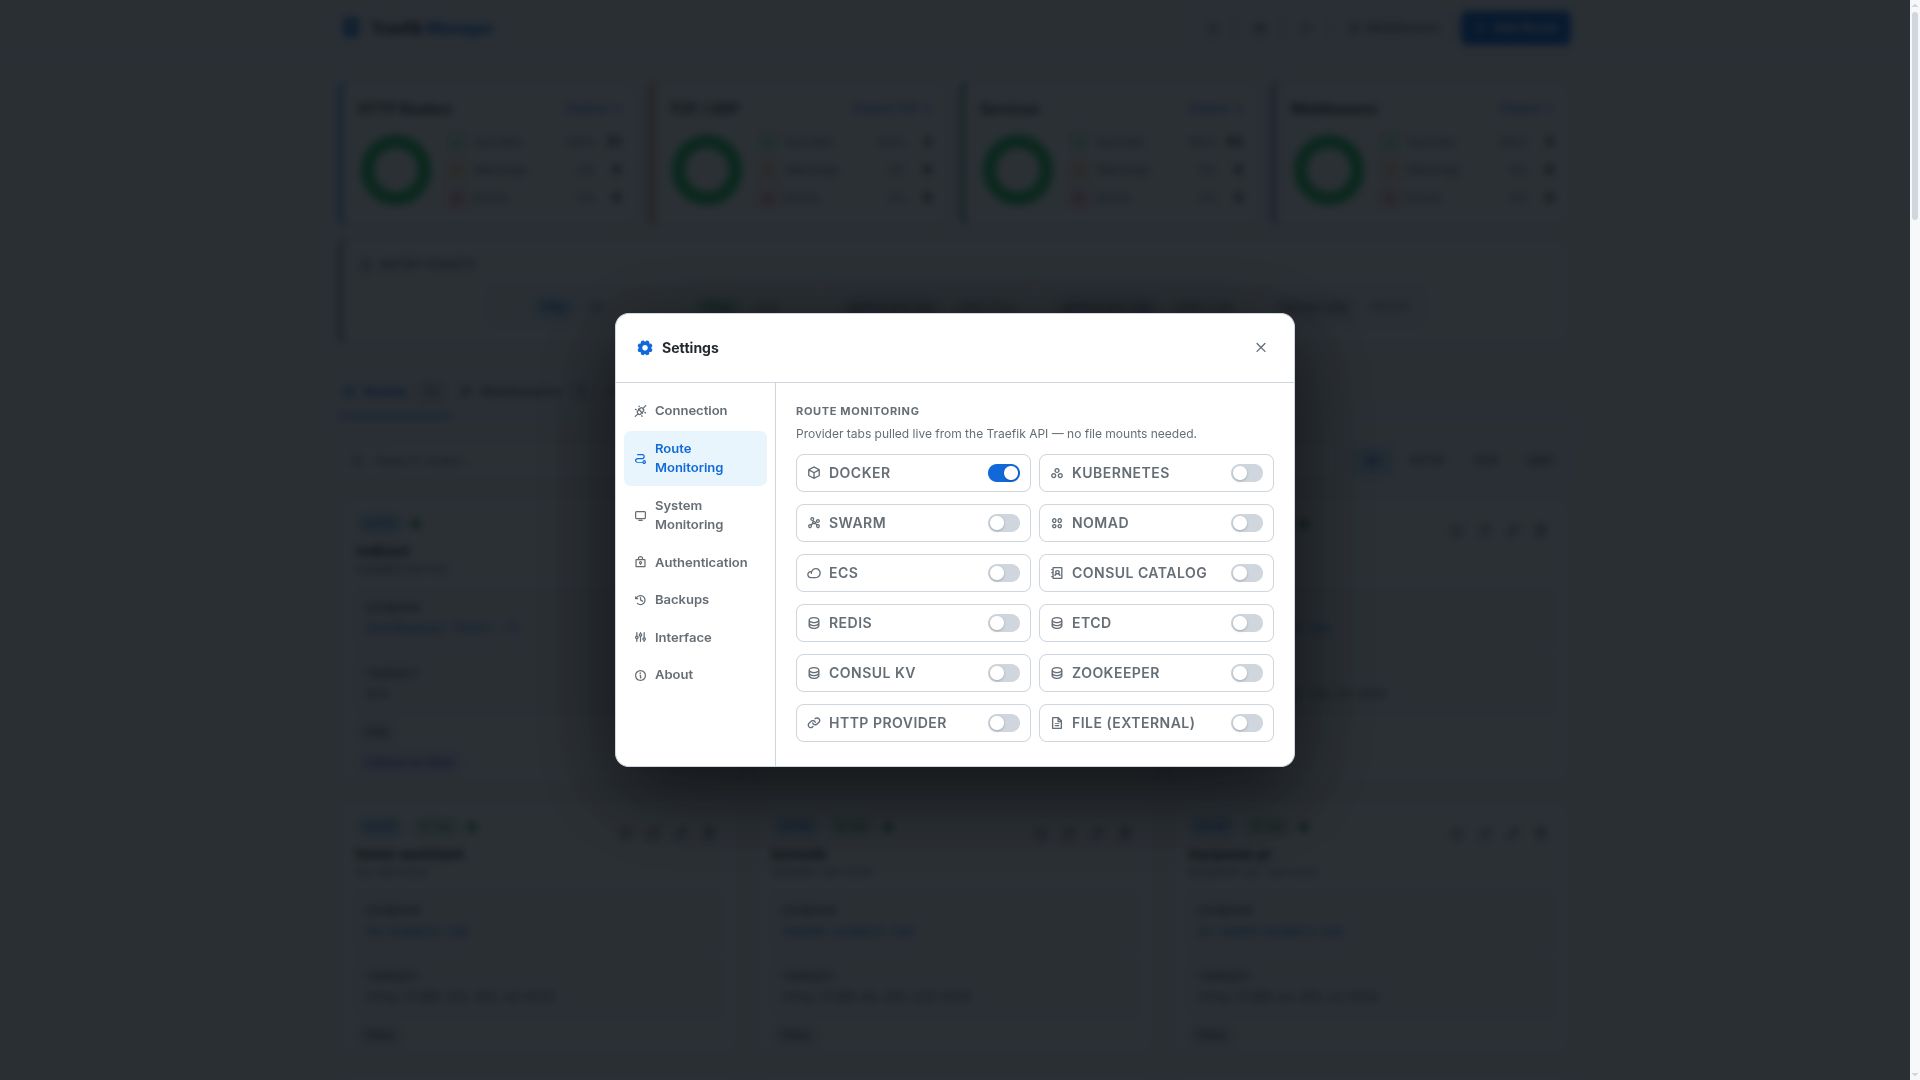
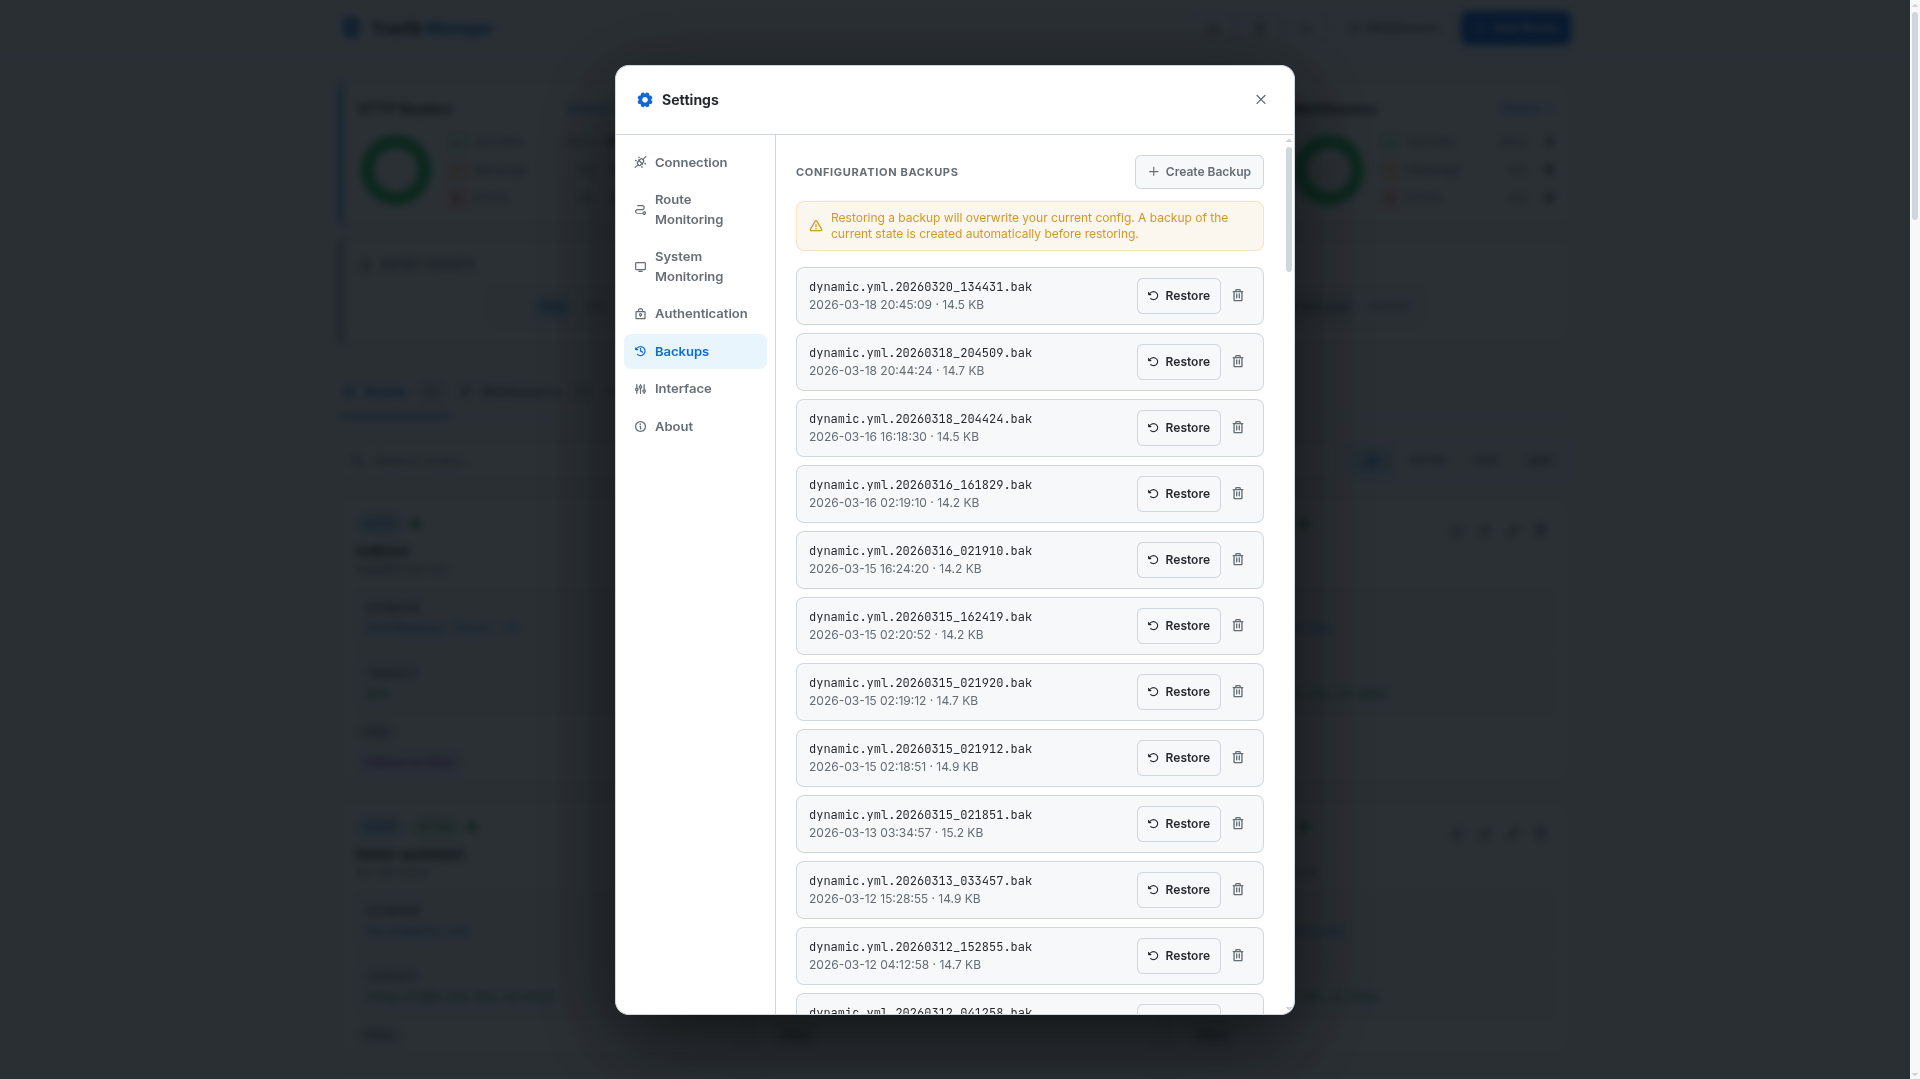
Settings
Authentication
Connections
Routes Config
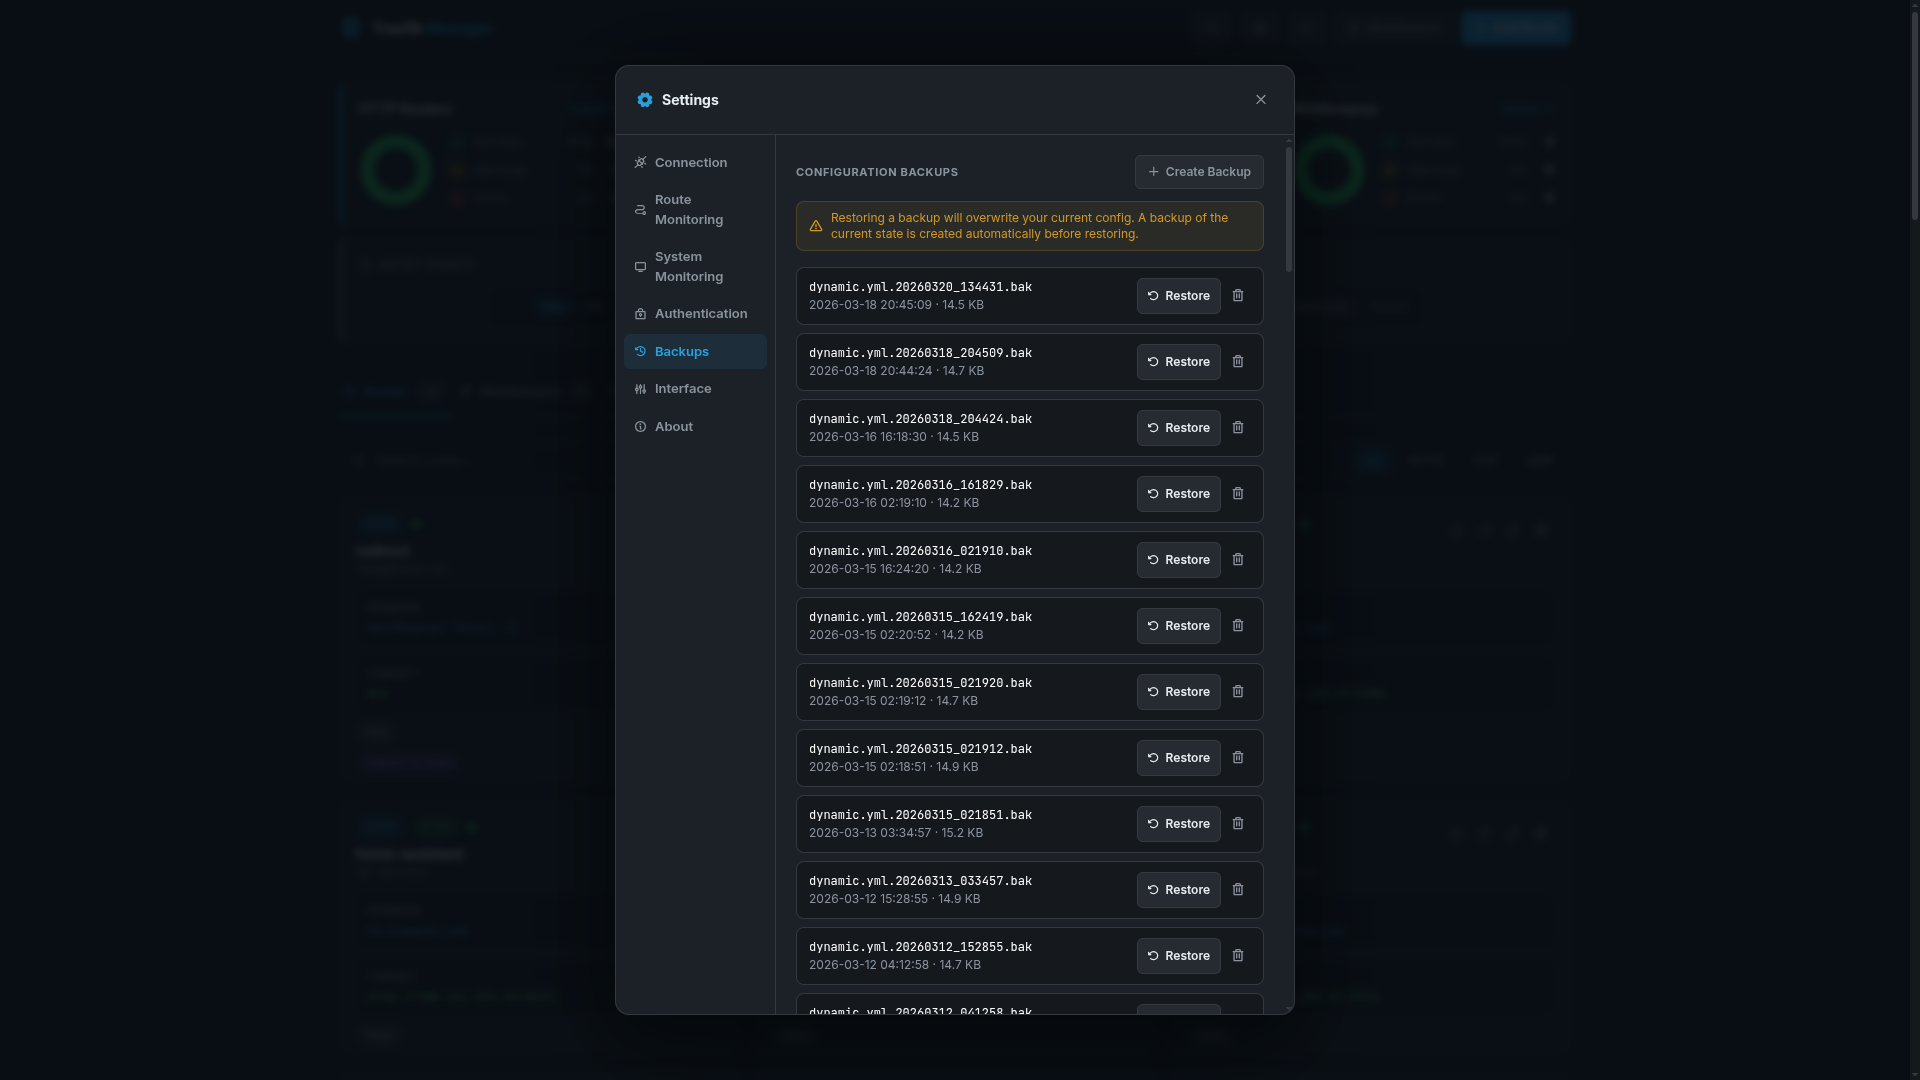
Backups
System
UI Preferences